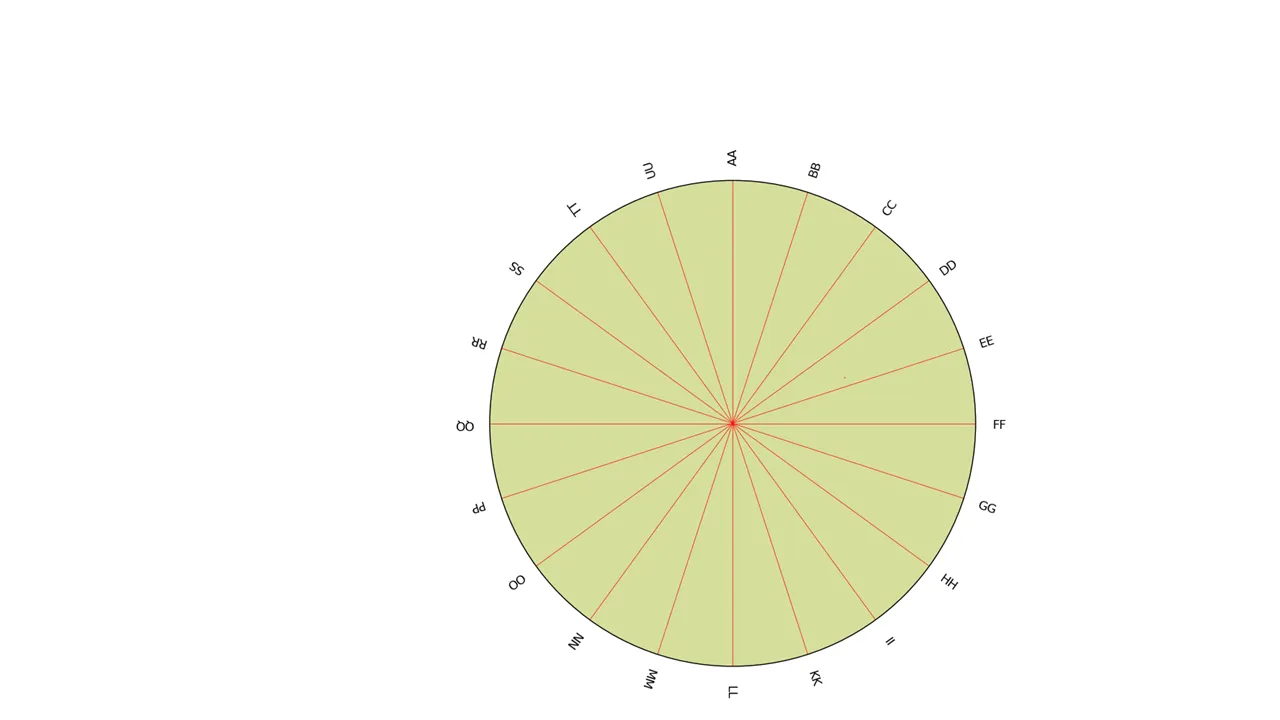
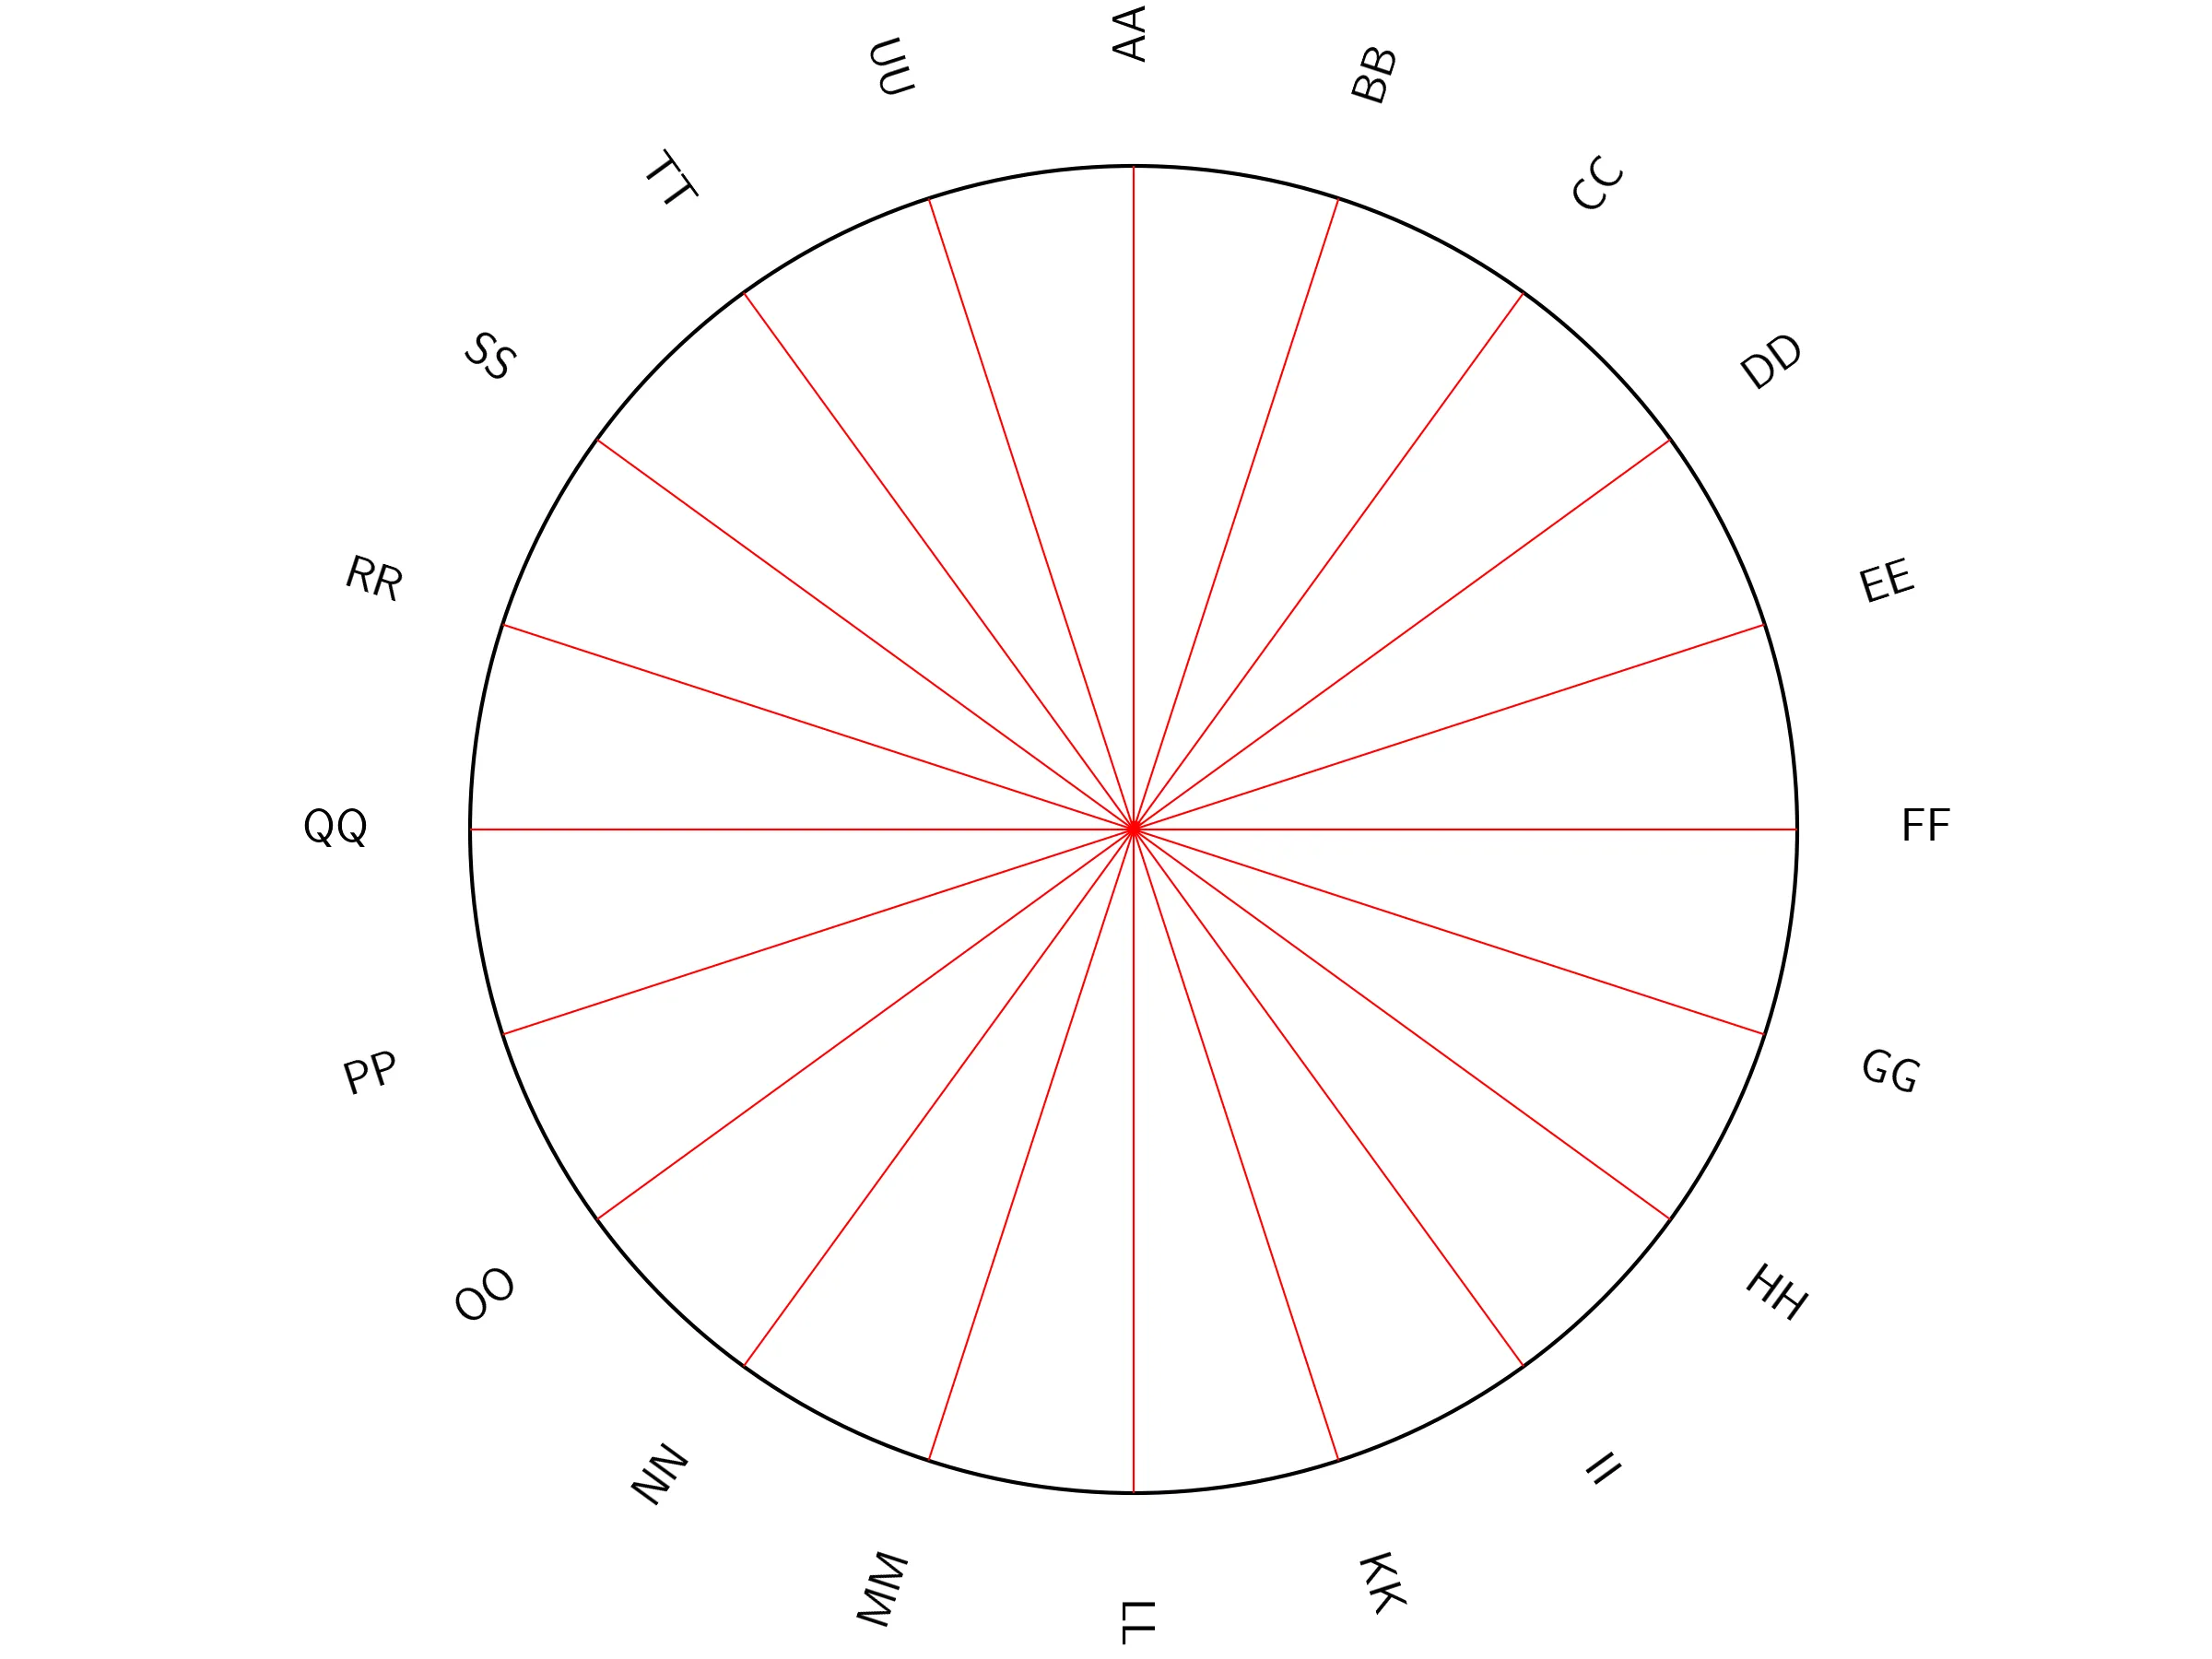
我正在尝试使用以下脚本绘制极坐标图。我希望thetagrid标签的角度与网格线对齐。(如图所示)
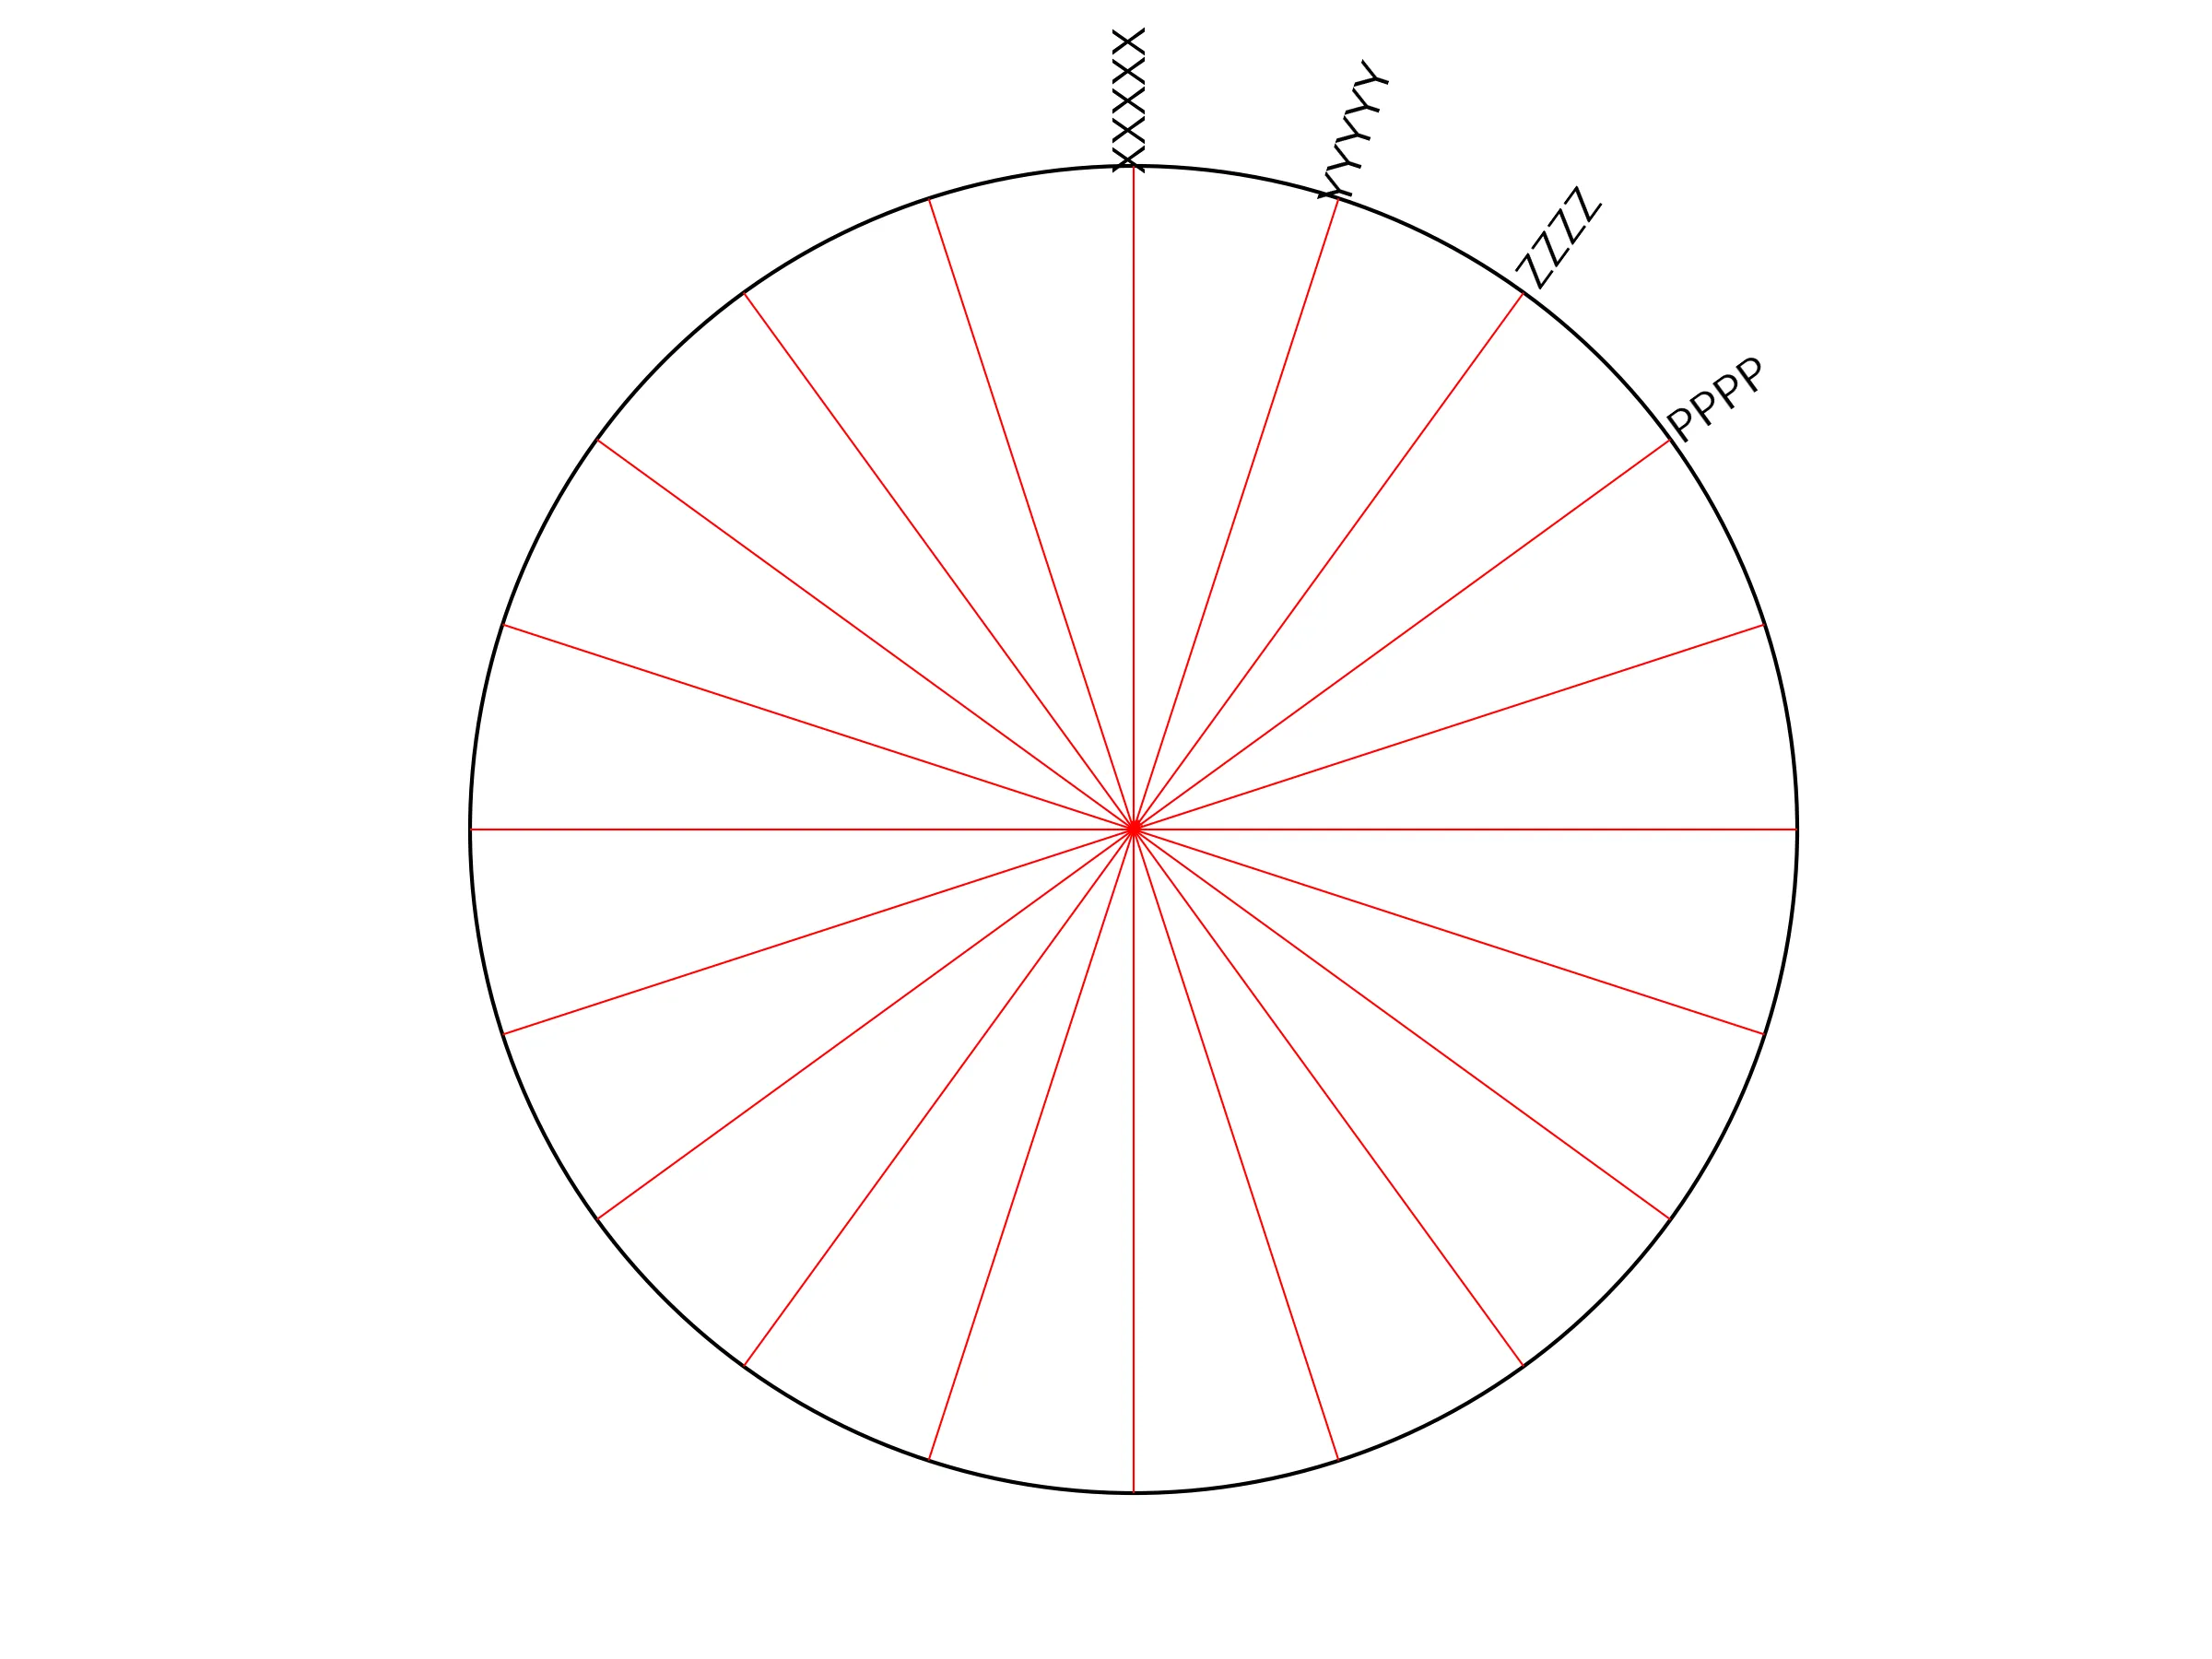
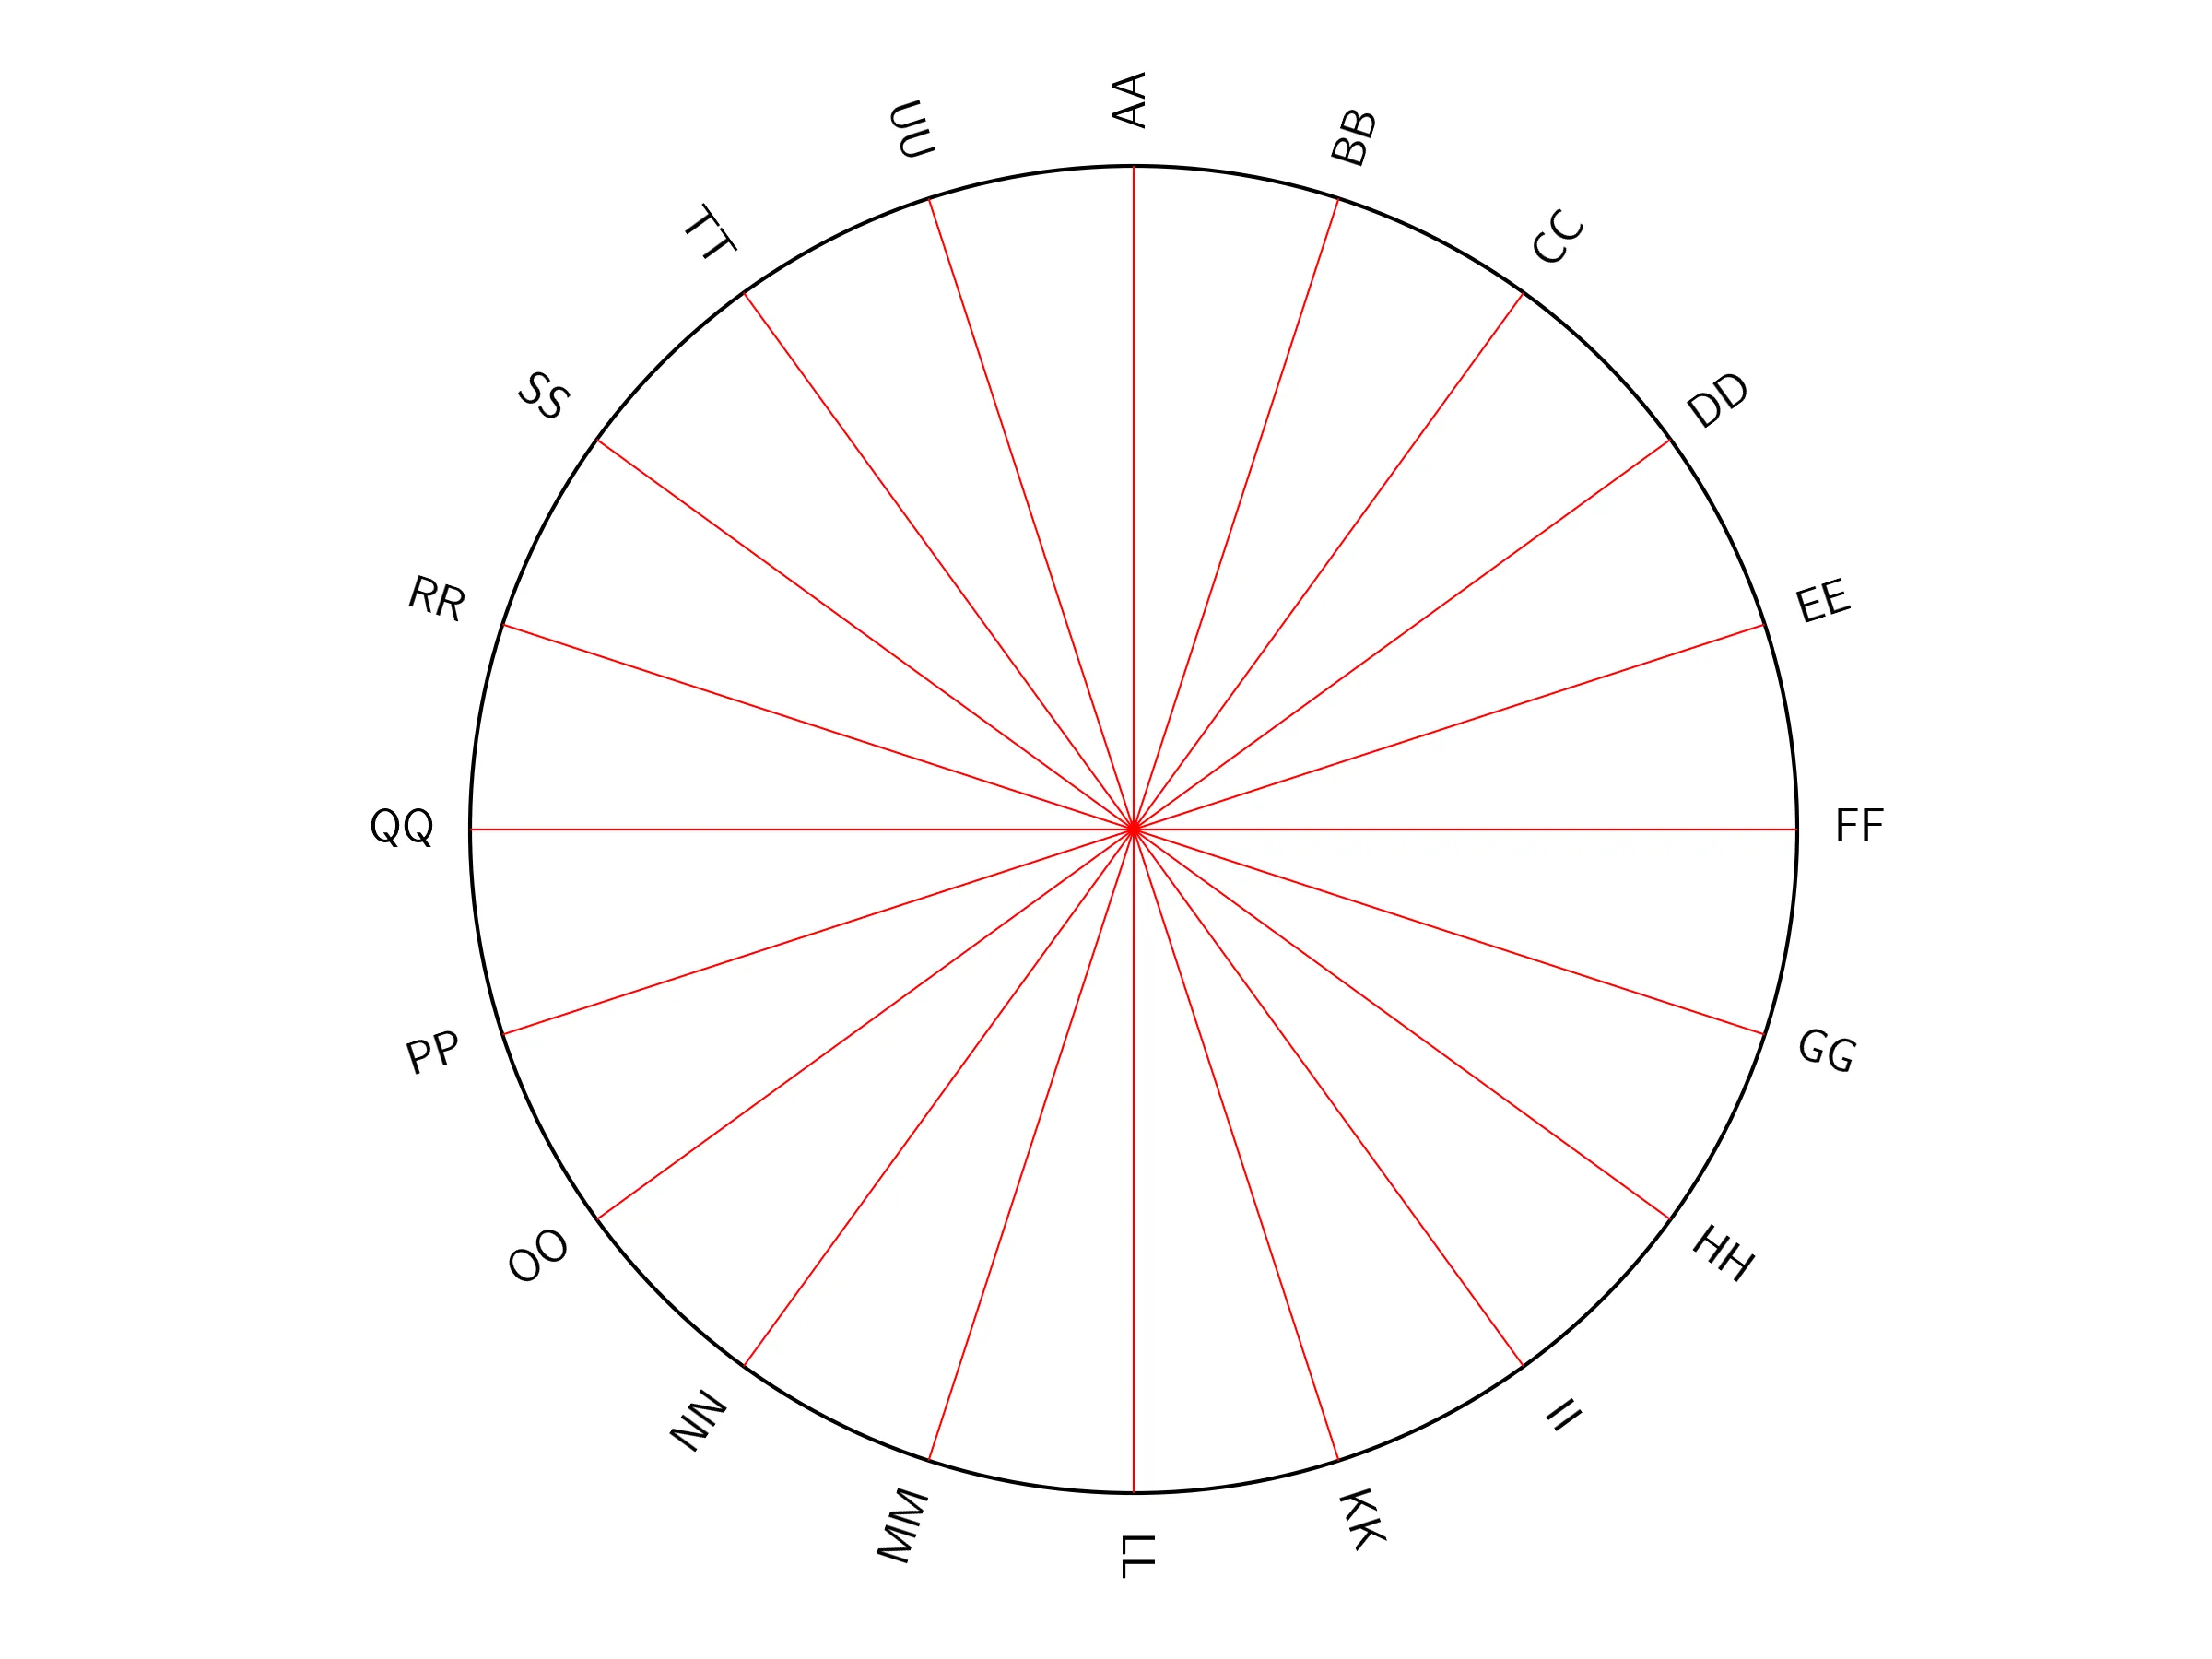
根据Tom的回答,我已经修改了代码。图的左半部分的标签似乎是倒置的。
from pylab import *
fig = figure()
rc('grid', color='r', linewidth=0.5, linestyle='-')
data1 = loadtxt("1.dat")
ax = plt.subplot(111,polar=True)
x= data1[:,0]
y= data1[:,1]
plt.scatter(x,y, s=0.1,color='r' )
gl, gt = ax.set_rgrids(range(10,81,10))
for l in gl: l.set_ls('')
(lines,labels)=thetagrids( range(0,360,18), ("AA", "BB", "CC", "DD", "EE", "FF", "GG", "HH", "II", "KK", "LL","MM","NN","OO","PP","QQ","RR","SS","TT","UU","VV"))
for label,angle in zip(labels,range(0,360,18)):
    label.set_rotation(90-angle)
    ax.set_theta_offset(np.pi/2.0)
    ax.set_theta_direction(-1)
    ax.set_yticklabels([])
    show()