我想在Matlab中的折线图上添加箭头以说明流向。箭头最好在线上,指向线的方向。这可行吗?
5个回答
1
quiver 函数应该能够做到您想要的事情。但是,您将需要自己计算箭头的方向。
以下类似于这样的内容可能很丑,但可以让您开始(但您可能需要规范化方向向量以获得更好的图形)
plot(x,y)
hold on
quiver(x(1:end-1),  y(1:end-1), ones(len(x)-1,1), y(2:end) - y(1:end-1))
- Kena
1
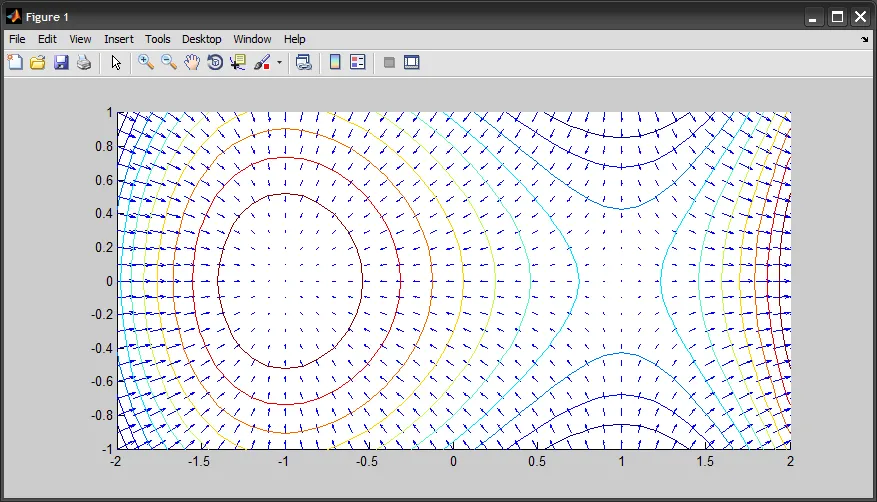
如果我理解正确,您正在尝试查看一个向量场?如果是这样,这里有一个可行的示例:
%# function: f(x,y)=x^3-2y^2-3x over x=[-2,2], y=[-1,1]
[X Y] = meshgrid(-2:.1:2, -1:.1:1);
Z = X.^3 -2*Y.^2 -3*X;
%# gradient of f
[dX dY] = gradient(Z, .1, .1);
%# plot the vector field and contour levels
figure, hold on
quiver(X, Y, dX, dY)
contour(X, Y, Z, 10)
axis equal, axis([-2 2 -1 1])
hold off
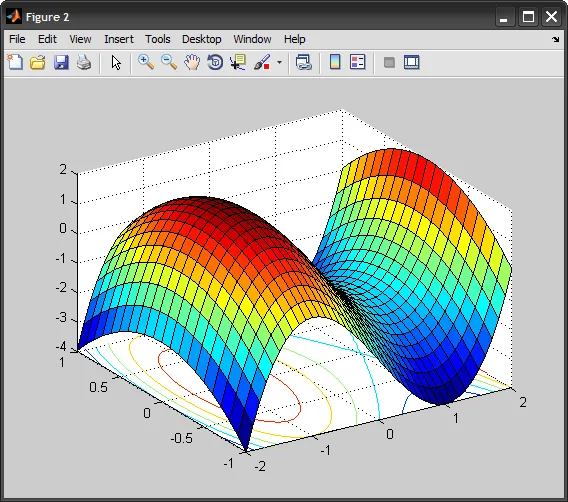
%# plot surface
figure, surfc(X, Y, Z)
view(3)
- Amro
0
您可以使用函数
请注意,对象的父级不是轴,而是图形窗口本身(这意味着当您缩放时,箭头在图形窗口中保持相同位置)。
annotation向图形添加箭头。请注意,对象的父级不是轴,而是图形窗口本身(这意味着当您缩放时,箭头在图形窗口中保持相同位置)。
- NoamG
网页内容由stack overflow 提供, 点击上面的可以查看英文原文,
原文链接
原文链接