好的,别说我没警告你 :)
f = @(x) 50* 1.6.^(-x-5);
g = @(x) 50* 1.6.^(+x-10);
xE = 2.5;
yE = f(xE);
figure(1), clf, hold on
x = 0:0.2:5;
plot(x,f(x),'r', x,g(x),'b', 'linewidth', 2)
set(gca, 'Xtick', [], 'Ytick', [], 'box', 'off')
axis([0 5 0 5])
plot(xE, yE, 'k.', 'markersize', 20)
line([xE 0; xE xE], [0 yE; yE yE], 'linestyle', '--', 'color', 'k')
xO = 0.2;
yO = 0.1;
patch(...
[5-xO -yO; 5-xO +yO; 5.0 0.0], ...
[yO 5-xO; -yO 5-xO; 0 5], 'k', 'clipping', 'off')
h = @(x)0.5*(x+0.2) + 0.1*sin((x+0.2)*14);
x = 2.7:0.01:3.5;
plot(x, h(x), 'k', 'linewidth', 2)
text(xE-yO, -0.2, 'Q^*', 'fontweight', 'bold')
text(-2*yO, yE, 'P^*', 'fontweight', 'bold')
text(-2*yO, 4, 'Price', 'rotation', 90, 'fontsize', 14)
text( 4, -0.2, 'Quantity', 'fontsize', 14)
text( .5, 4.2, 'Demand', 'fontsize', 14, 'rotation', -55)
text( 4.0, 3.3, 'Supply', 'fontsize', 14, 'rotation', +55)
text( 3.6, 2.1, 'Equilibrium', 'fontsize', 14)
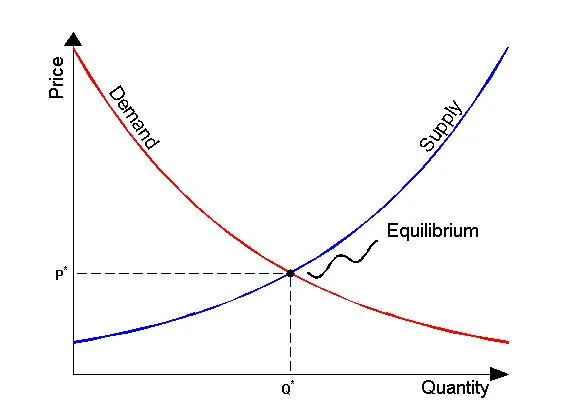
结果: