如何在森林图中添加箭头?

3

我希望您能为一篇提交到期刊的论文添加两个箭头到森林图中。这是来自metafor::forest的演示图:

require(metafor)
data(dat.bcg)
res <- rma(measure="RR", ai=tpos, bi=tneg, ci=cpos, di=cneg, data=dat.bcg,
           slab=paste(author, year, sep=", "))
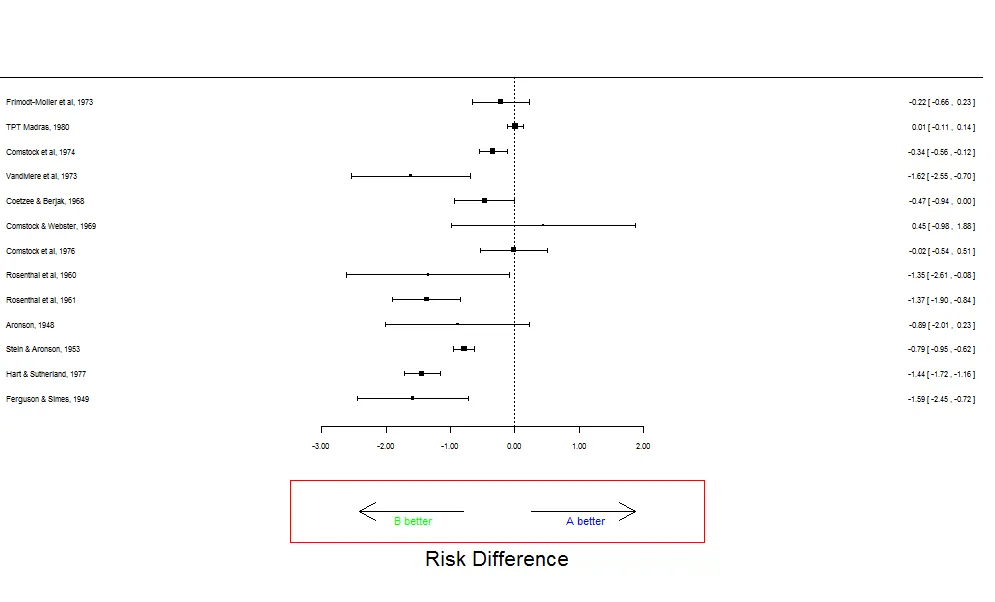
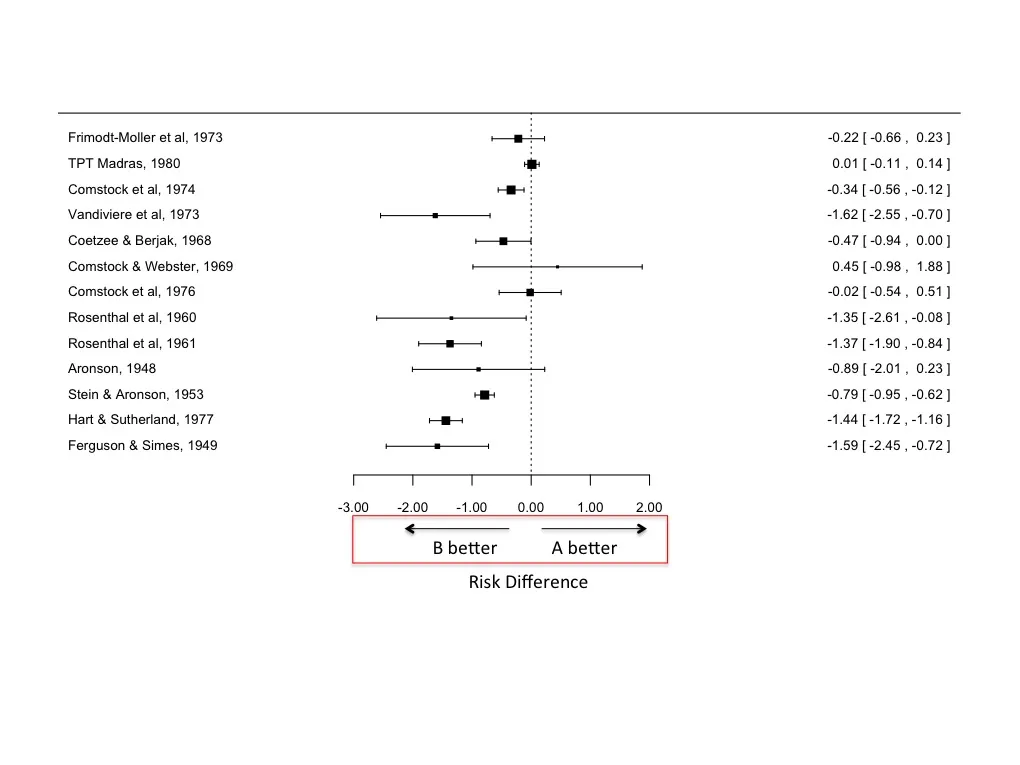
forest(res, cex=.8, order=order(dat.bcg$ablat), addfit=F)

我想要的是在x轴上添加两个箭头,就像这样(红框内): enter image description here 有人知道如何实现吗?
1个回答

3

一种想法是使用layout将图形分为两部分,并用新的图形替换x轴标签。

enter image description here

## define the layout matrix  
## 2 rows and 3 columns , the rectangle will be in the cell(2,2)
layout(matrix(c(1,1,1,0,2,0), 2, 3, byrow = TRUE),
       heights=c(3,1),widths=c(1,2,1))
## define the margin since the default ones are usually not enough
par(mar = rep(2, 4))

## your plot here 
data(dat.bcg)
res <- rma(measure="RR", ai=tpos, bi=tneg, ci=cpos, di=cneg, data=dat.bcg,
           slab=paste(author, year, sep=", "))
forest(res, cex=.8, order=order(dat.bcg$ablat), addfit=F,xlab='')

## here all the job 
x <- y <- 2:8 
## dummy plot to define scales
plot(x,y,type='n',axes=F,xlab='',ylab='')
## rectangle
rect(2,4,8,8,border='red')
## arrows
arrows(5.5,6,7,6)
arrows(4.5,6,3,6)
text(6,6,'A better',adj=c(0,1.5),col='blue')
text(3.5,6,'B better',adj=c(0,1.5),col='green')
## x label
text(5,3,'Risk Difference',cex=2)

谢谢,@agstudy。红色矩形不是绘图的一部分,只是一个指示器:D。 - David Z
1
@DavidZ :) 我喜欢它!我会把它保留在我的回答中! - agstudy
@agstudy有没有办法使用R的forestplot包将这个添加到森林图中?我已经在https://stackoverflow.com/questions/61765729/add-arrows-to-forestplot-r?noredirect=1&lq=1上发布了一个关于此问题的提问。 - sar

网页内容由stack overflow 提供, 点击上面的
可以查看英文原文,
原文链接