我知道有一个名为注释的函数可以绘制箭头或双箭头。但是注释只能在标准化单位中进行绘制。例如:
annotation('arrows',[x1 x2],[y1 y2])
这里,[x1,x2] 应该是一个小于一的比率数。
那么,我的问题是如何绘制箭头以显示真实值而不是归一化值?
我想知道是否有其他函数可以处理这个问题,或者是否有函数可以获取图表的轴值,以便我可以将真实值调整为归一化值。
我知道有一个名为注释的函数可以绘制箭头或双箭头。但是注释只能在标准化单位中进行绘制。例如:
annotation('arrows',[x1 x2],[y1 y2])
这里,[x1,x2] 应该是一个小于一的比率数。
那么,我的问题是如何绘制箭头以显示真实值而不是归一化值?
我想知道是否有其他函数可以处理这个问题,或者是否有函数可以获取图表的轴值,以便我可以将真实值调整为归一化值。
Matlab提供了dsxy2figxy函数来将数据空间点转换为归一化空间坐标以定位注释。但由于某些原因,该函数未包含在Matlab发行版中,需要首先"创建"它。
将以下代码复制到命令窗口并执行,即可在编辑器中打开该函数。
edit(fullfile(docroot,'techdoc','creating_plots','examples','dsxy2figxy.m'))
要使用函数dsxy2figxy,请在Matlab搜索路径中保存它。
请查找函数dsxy2figxy的完整说明书,请访问matlab-central:http://www.mathworks.de/help/techdoc/creating_plots/bquk5ia-1.html
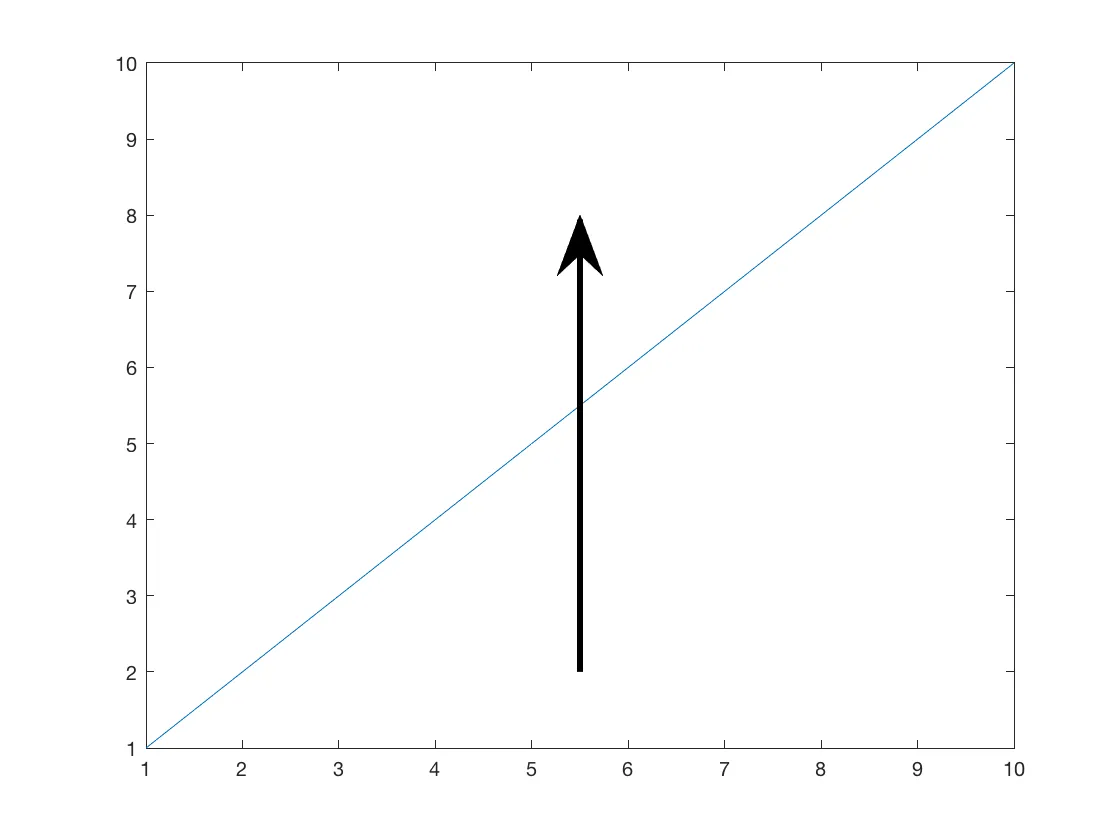
即使注释默认使用标准化作为单位,您仍然可以将这些对象关联到当前轴(gca)并使用数据单位设置X和Y属性。
下面是绘制单个箭头的示例。
plot(1:10);
ha = annotation('arrow');  % store the arrow information in ha
ha.Parent = gca;           % associate the arrow the the current axes
ha.X = [5.5 5.5];          % the location in data units
ha.Y = [2 8];

ha.LineWidth  = 3;          % make the arrow bolder for the picture
ha.HeadWidth  = 30;
ha.HeadLength = 30;
我刚刚发现了一种方法,因为我不想麻烦地使用规范化的单位。使用latex解释器:
figure
plot([1:5],[1:5]*3,'.-')
%// Say I want to put an arrow pointing to the location, [3 9]
text(2.94,8.3,'\uparrow','fontsize',20)
text(2.8,7.8,'point [3,9]')
如果想要箭头更长,请使用较大的字体大小。
优点:
缺点:
如果我没记错的话,您需要计算轴与图形之间的位置关系。
应该像这样进行:
%% example plot
clf
plot(rand(5,2)*5)
%% get info specific to the axes you plan to plot into
set(gcf,'Units','normalized')
set(gca,'Units','normalized')
ax = axis;
ap = get(gca,'Position')
%% annotation from 1,2 to 3,4
xo = [1,3];
yo = [2,4];
xp = (xo-ax(1))/(ax(2)-ax(1))*ap(3)+ap(1);
yp = (yo-ax(3))/(ax(4)-ax(3))*ap(4)+ap(2);
ah=annotation('arrow',xp,yp,'Color','r');
注意:修正原计算中的偏移量 - ap(3),ap(4) 是gca的宽度和高度,而不是角落位置。
arrowObj = annotation('arrow', [0.1 0.1], [0.5 0.5]);
set(arrowObj, 'Units', 'centimeters');
set(arrowObj, 'Position', [1 1 3 5]);
annotation(..) 的第一个参数是必要的,通常有用的单位选择是 'pixels'。 - Evgeni SergeevAx=[0 -0.003 0.003 0]; % (Ax,Ay) form an upward pointing arrowhead.
Ay=[0.01 0.0060 0.0060 0.01];
Ax=Ax-mean(Ax); % center it on zero
Ay=Ay-mean(Ay);
然后在曲线 vv 上的所需箭头索引处计算
x1=vv(in,1); y1=vv(in,2);
x2=vv(in+1,1); y2=vv(in+1,2);
u=x2-x1;
v=y2-y1;
th=-pi/2+atan2(v,u);
R=[cos(th) -sin(th); sin(th) cos(th)];   % Rotation matrix for local slope of vv.
A=R*[Ax;Ay];    % Rotate the arrowhead.
patch(x1+A(1,:),y1+A(2,:),'r','LineWidth',0.01)   % plot rotated arrowhead at (x1,y1).
plot(x1+A(1,:),y1+A(2,:),'r','LineWidth',0.01)    % Kludge to make boundary red too (I'm sure there is a more elegant way).
对于我的特定情况,这对我很有效。
您可以在(有良好文档记录的)DaVinci Draw 工具箱中使用“箭头”组件(完全透明:我编写/销售该工具箱,但箭头是免费的)。
以下是示例语法和示例输出。
davinci( 'arrow', 'X', [0 10], 'Y', [0 2], <plus-lots-of-options> )
addpath(fullfile(docroot,'techdoc','creating_plots','examples'))也会将示例函数放在您的MATLAB路径上(假设该文件存在)。 - Emil Lundberg