我正在使用MATLAB,遇到了一个非常简单的问题:我有一个由其位置(x,y)和theta(一个角度,以度为单位)定义的对象。我想绘制该点并添加一个箭头,从该点开始指向由角度定义的方向。实际上它不必是一个箭头,任何用图形显示角度值的东西都可以!
下面是一张展示我试图画的东西的图片:
已删除失效的ImageShack链接
quiver() 绘图函数绘制箭头,如下所示。将 theta 值转换为表示要作为箭头绘制的向量的 (x, y) 笛卡尔坐标,并将其用作 quiver() 的 (u,v) 参数。
theta = pi/9;
r = 3; % magnitude (length) of arrow to plot
x = 4; y = 5;
u = r * cos(theta); % convert polar (theta,r) to cartesian
v = r * sin(theta);
h = quiver(x,y,u,v);
set(gca, 'XLim', [1 10], 'YLim', [1 10]);
查看Matlab文档,以了解其他绘图类型,其中包括几种径向图。它们位于MATLAB > 函数 > 图形 > 专用绘图部分。在命令行中执行“doc quiver”并浏览。
x = 1;                          % X coordinate of arrow start
y = 2;                          % Y coordinate of arrow start
theta = pi/4;                   % Angle of arrow, from x-axis
L = 2;                          % Length of arrow
xEnd = x+L*cos(theta);          % X coordinate of arrow end
yEnd = y+L*sin(theta);          % Y coordinate of arrow end
points = linspace(0, theta);    % 100 points from 0 to theta
xCurve = x+(L/2).*cos(points);  % X coordinates of curve
yCurve = y+(L/2).*sin(points);  % Y coordinates of curve
plot(x+[-L L], [y y], '--k');   % Plot dashed line
hold on;                        % Add subsequent plots to the current axes
axis([x+[-L L] y+[-L L]]);      % Set axis limits
axis equal;                     % Make tick increments of each axis equal
arrow([x y], [xEnd yEnd]);      % Plot arrow
plot(xCurve, yCurve, '-k');     % Plot curve
plot(x, y, 'o', 'MarkerEdgeColor', 'k', 'MarkerFaceColor', 'w');  % Plot point
以下是它的外观:
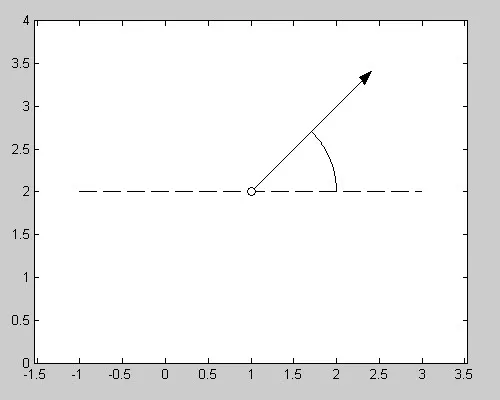
您可以使用 text 函数为图中的角度和坐标值添加文本。