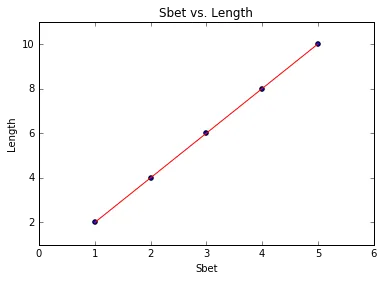
将matplotlib图的坐标轴设置为数据框列名

3

我有一个类似这样的数据框:

data = DataFrame({'Sbet': [1,2,3,4,5], 'Length' : [2,4,6,8,10])

然后我有一个函数来绘制并拟合这些数据

def lingregress(x,y):
    slope, intercept, r_value, p_value, std_err = stats.linregress(x,y)
    r_sq = r_value ** 2

    plt.scatter(x,y)
    plt.plot(x,intercept + slope * x,c='r')

    print 'The slope is %.2f with R squared of %.2f' % (slope, r_sq)

然后我会在数据框上调用该函数:
 linregress(data['Sbet'],data['Length'])

我的问题是如何在函数内获取x轴标签和y轴标签为SbetLength,以及绘图标题为Sbet vs Length。我尝试了几种方法,但使用plt.xlabel(data['Sbet'])plt.title时往往会返回整个列。

1个回答

4

有序列的列

按照定义好的顺序构建数据框中的列:

data = DataFrame.from_items([('Sbet', [1,2,3,4,5]), ('Length', [2,4,6,8,10])])

现在您可以将第一列用作x,将第二列用作y

def lingregress(data):
    x_name = data.columns[0]
    y_name = data.columns[1]
    x = data[x_name]
    y = data[y_name]
    slope, intercept, r_value, p_value, std_err = stats.linregress(x,y)
    r_sq = r_value ** 2

    plt.scatter(x,y)
    plt.xlabel(x_name)
    plt.ylabel(y_name)
    plt.title('{x_name} vs. {y_name}'.format(x_name=x_name, y_name=y_name))
    plt.plot(x,intercept + slope * x,c='r')

    print('The slope is %.2f with R squared of %.2f' % (slope, r_sq))


lingregress(data)

显式列名

字典没有有用的顺序。因此,您不知道列的顺序,需要明确提供名称的顺序。

这将起作用:

def lingregress(data, x_name, y_name):
    x = data[x_name]
    y = data[y_name]
    slope, intercept, r_value, p_value, std_err = stats.linregress(x,y)
    r_sq = r_value ** 2

    plt.scatter(x,y)
    plt.xlabel(x_name)
    plt.ylabel(y_name)
    plt.title('{x_name} vs. {y_name}'.format(x_name=x_name, y_name=y_name))
    plt.plot(x,intercept + slope * x,c='r')

    print('The slope is %.2f with R squared of %.2f' % (slope, r_sq))


lingregress(data, 'Sbet', 'Length')

enter image description here


1
这需要大量手动/显式的工作。想象一下有很多列名.. 真的没有更智能/自动化的推断方式将df中的名称列与matplotlib链接起来吗? - WestCoastProjects

网页内容由stack overflow 提供, 点击上面的
可以查看英文原文,
原文链接