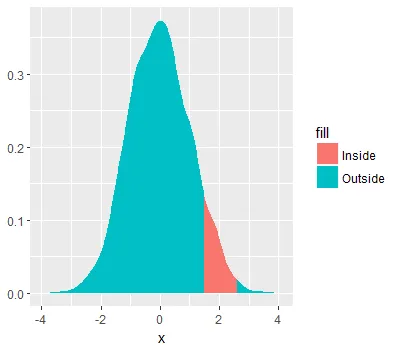
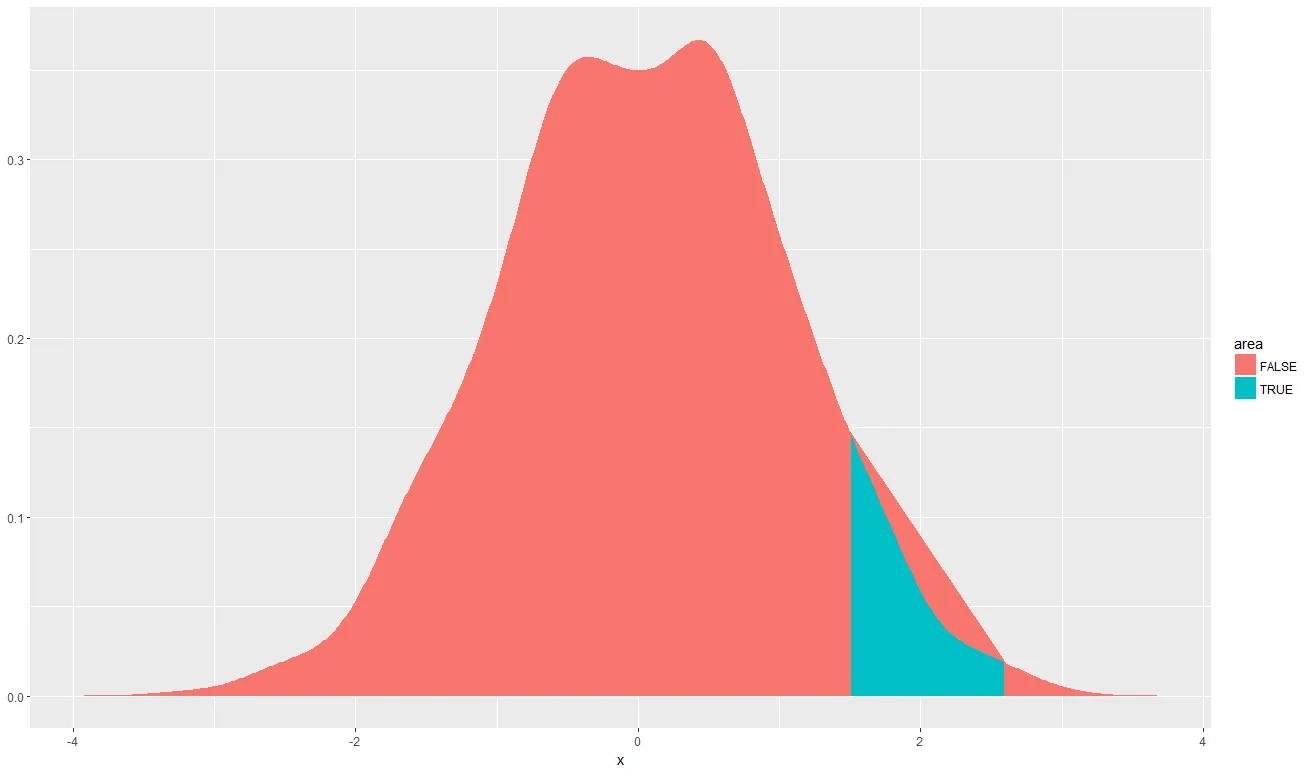
我想填补曲线下的一个小区域。然而,带状几何图形将分布的两个“部分”连接在一起。
library(tidyverse)
density(rnorm(1000, 0, 1)) %$%
  data.frame(x=x, y=y) %>%
  mutate(area = dplyr::between(x, 1.5, 2.6)) %>%
  ggplot() +
  geom_ribbon(aes(x = x, ymin = 0, ymax = y, fill = area))
我认为避免这种行为的一种方法是将分布分成三个不同的部分,并用相同的颜色填充其中两个部分。然而,我正在寻找更加简洁和优雅的方式。