我试图在R中给曲线下方着色。 我做得不太对,也不确定原因。 曲线由定义
# Define the Mean and Stdev
mean=1152
sd=84

# Create x and y to be plotted
# x is a sequence of numbers shifted to the mean with the width of sd.
# The sequence x includes enough values to show +/-3.5 standard deviations in the data set.
# y is a normal distribution for x
x <- seq(-3.5,3.5,length=100)*sd + mean
y <- dnorm(x,mean,sd)
情节是
# Plot x vs. y as a line graph
plot(x, y, type="l")
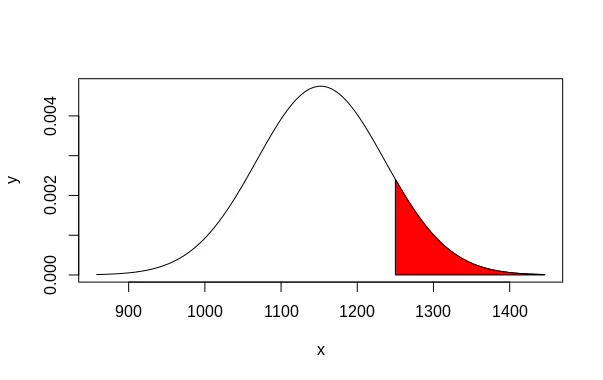
我正在使用的代码尝试对x>=1250的曲线下方着色是:
polygon(c( x[x>=1250], max(x) ), c(y[x==max(x)], y[x>=1250] ), col="red")
但这是我得到的结果
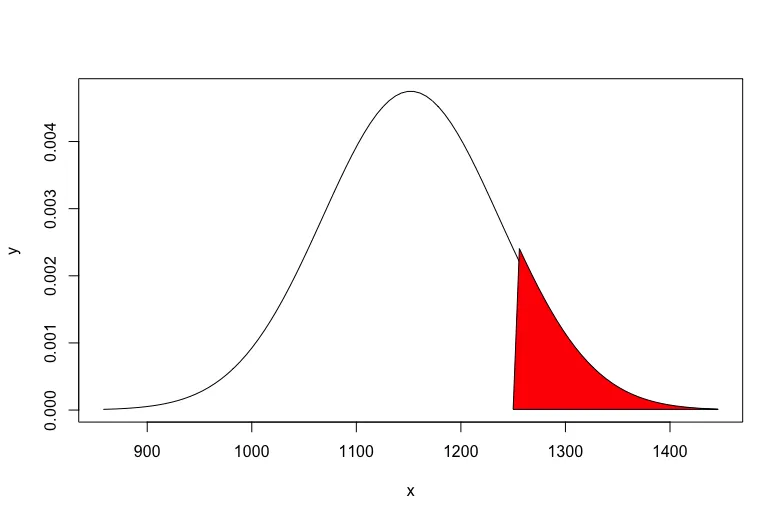 如何正确着色曲线下x >= 1250的那部分