要填充曲线下方的部分,您必须使用filledcurves样式。使用 x1 选项可以填充曲线和 x 轴之间的部分。
如果您只想填充曲线的某些部分,则必须过滤您的数据,即如果x值在所需范围之外则将其赋值为1/0(无效数据点),否则从数据文件中获取正确的值。最后,您绘制曲线本身:
set style fill transparent solid 0.35 noborder
filter(x,min,max) = (x > min && x < max) ? x : 1/0
plot 'data' using (filter($1, -1, -0.5)):2 with filledcurves x1 lt 1 notitle,\
     ''  using (filter($1, 0.2, 0.8)):2 with filledcurves x1 lt 1 notitle,\
     ''  using 1:2 with lines lw 3 lt 1 title 'curve'
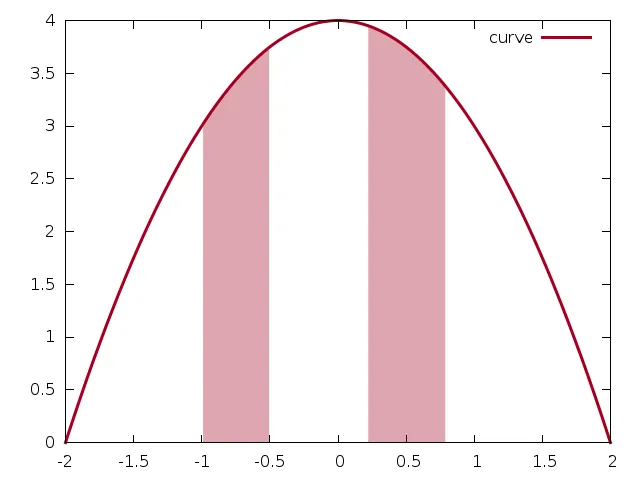
这填充了范围[-1:0.5]和[0.2:0.8]。
为了举个例子,我使用特殊的文件名+:
set samples 100
set xrange [-2:2]
f(x) = -x**2 + 4

set linetype 1 lc rgb '#A3001E'

set style fill transparent solid 0.35 noborder
filter(x,min,max) = (x > min && x < max) ? x : 1/0
plot '+' using (filter($1, -1, -0.5)):(f($1)) with filledcurves x1 lt 1 notitle,\
     ''  using (filter($1, 0.2, 0.8)):(f($1)) with filledcurves x1 lt 1 notitle,\
     ''  using 1:(f($1)) with lines lw 3 lt 1 title 'curve'
使用结果 (使用4.6.4版本):
如果必须使用某种平滑方法,滤波器可能会对数据曲线产生不同的影响,具体取决于被滤波的部分。您可以先将平滑后的数据写入临时文件,然后将其用于“正常”绘图:
set table 'data-smoothed'
plot 'data' using 1:2 smooth bezier
unset table

set style fill transparent solid 0.35 noborder
filter(x,min,max) = (x > min && x < max) ? x : 1/0
plot 'data-smoothed' using (filter($1, -1, -0.5)):2 with filledcurves x1 lt 1 notitle,\
     ''  using (filter($1, 0.2, 0.8)):2 with filledcurves x1 lt 1 notitle,\
     ''  using 1:2 with lines lw 3 lt 1 title 'curve'
 问题是我想在同一图中多次执行此操作。