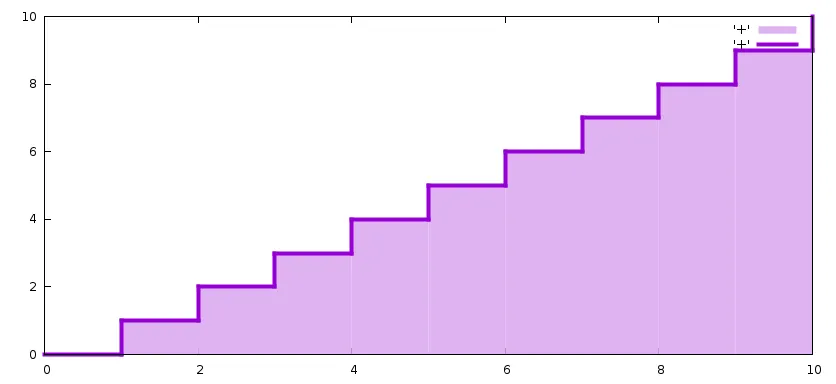
我正在使用Gnuplot从输入文件中绘制阶梯函数: plot 'myFile' using 1:2 with steps 我想填充图形下方的部分。类似于:plot 'myFile' using 1:2 with filledcurves 但是Gnuplot通过在连续点之间绘制一条线来填充图表下方。如何在阶梯函数下方填充颜色?
使用fillsteps绘图样式,该样式与steps相同,但曲线和y=0之间的区域被填充:set samples 11 set xrange [0:10] plot '+' with fillsteps fs solid 0.3 noborder lt 1,\ '+' with steps lt 1 lw 4