两个函数之间的填充区域

3
import matplotlib.pyplot as plt
import numpy as np

def domain():
    x = np.arange(0, 10, 0.001)

    f1 = lambda x: (2*x - x**2)**0.5
    plt.plot(x, f1(x), label = '$y = \sqrt{2x - x^2}$')
    plt.plot(f1(x), x, label = '$x = \sqrt{2y - y^2}$')
    plt.xlabel('X')
    plt.ylabel('Y')
    plt.legend(loc='best')


    axes = plt.gca()
    axes.set_xlim([0, 5])
    axes.set_ylim([0, 5])
    plt.show()

domain()

enter image description here

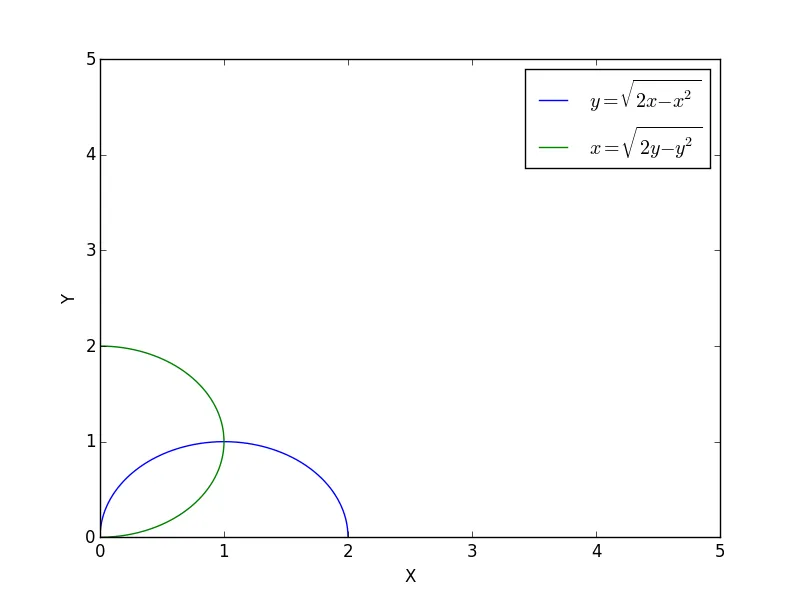
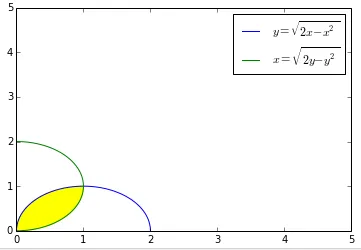
如何使用 fill_between() 填充两条线之间的区域?换句话说,如何填充绿色和蓝色线之间的小花瓣?
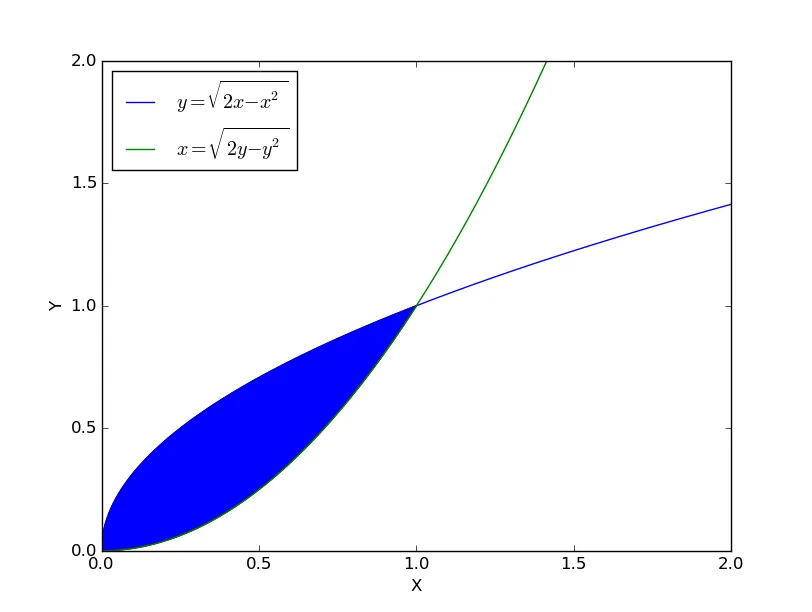
2个回答

6

@user 5061的代码是正确的,只有反函数存在问题。

import matplotlib.pyplot as plt
import numpy as np

def domain():
    x = np.arange(0, 10, 0.001)

    f1 = lambda x: (2*x - x**2)**0.5
    f2 = lambda x: 1 - (1-x*x)**0.5 # other part is f2 = lambda x: 1 + (1-x*x)**0.5
    plt.plot(x, f1(x), label = '$y = \sqrt{2x - x^2}$')
    plt.plot(f1(x), x, label = '$x = \sqrt{2y - y^2}$')
    plt.fill_between(x, f1(x), f2(x), where=f1(x)>=f2(x), interpolate=True, color='yellow')
    plt.xlabel('X')
    plt.ylabel('Y')
    plt.legend(loc='best')


    axes = plt.gca()
    axes.set_xlim([0, 5])
    axes.set_ylim([0, 5])
    plt.show()

domain()

不需要考虑正值组成部分1 + (1-x*x)**0.5,因为它不会影响交点。

enter image description here


我明白你在f2中用x表达了y,但是你有两个可能的表达式,对吧?基于什么原因你选择了带+号的那个表达式? - AlvinL
对于 0<x<1,表达式 1 + (1-x*x)**0.5 总是 >1,因此推导使用 1 - (1-x*x)**0.5 - Zero

2
你可以使用fill_between()函数,在满足条件时填充两条线之间的区域。

enter image description here

(我稍微修改了你的代码,因为你编写的方式需要找到f1的反函数)
import matplotlib.pyplot as plt
import numpy as np

def domain():
    x = np.arange(0, 2, 0.001)

    f = lambda x: x**0.5
    g = lambda x: x**2
    plt.plot(x, f(x), label = '$y = \sqrt{2x - x^2}$')
    plt.plot(x, g(x), label = '$x = \sqrt{2y - y^2}$')
    plt.xlabel('X')
    plt.ylabel('Y')
    plt.legend(loc='best')

    plt.fill_between(x, f(x), g(x),where=f(x) > g(x))

    axes = plt.gca()
    axes.set_xlim([0, 2])
    axes.set_ylim([0, 2])

    plt.show()

domain()

网页内容由stack overflow 提供, 点击上面的
可以查看英文原文,
原文链接