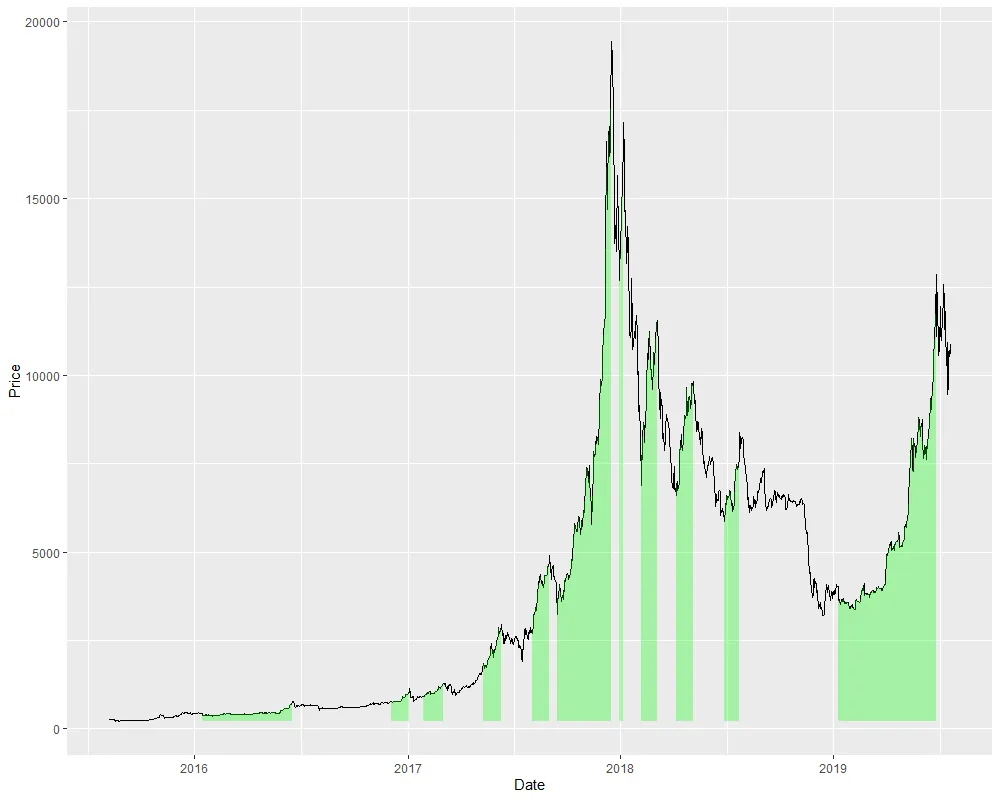
我正在尝试根据0和1的因子值填充时间序列线下面的区域。只有当值等于1时,才应该填充该区域。
我已经使用以下代码根据因子值对时间序列线进行了着色:
install.packages("scales")
library("scales")
library("ggplot2")
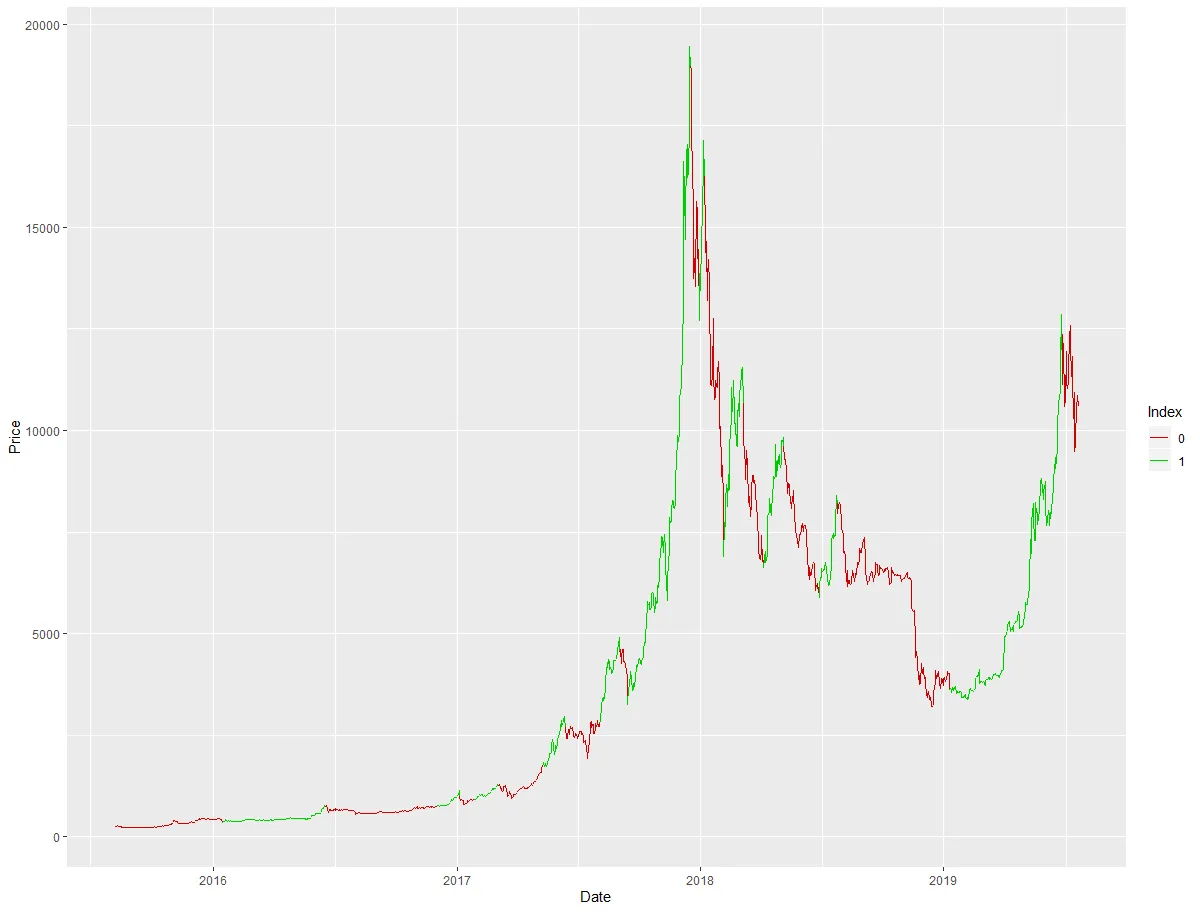
ggplot(plot.timeseries) +
geom_line(aes(x = Date, y = Price, color = Index, group = 1)) +
scale_x_date(labels = date_format("%Y"), breaks = date_breaks("years")) +
scale_colour_manual(values = c("red3", "green3"))
这提供了以下的图表:
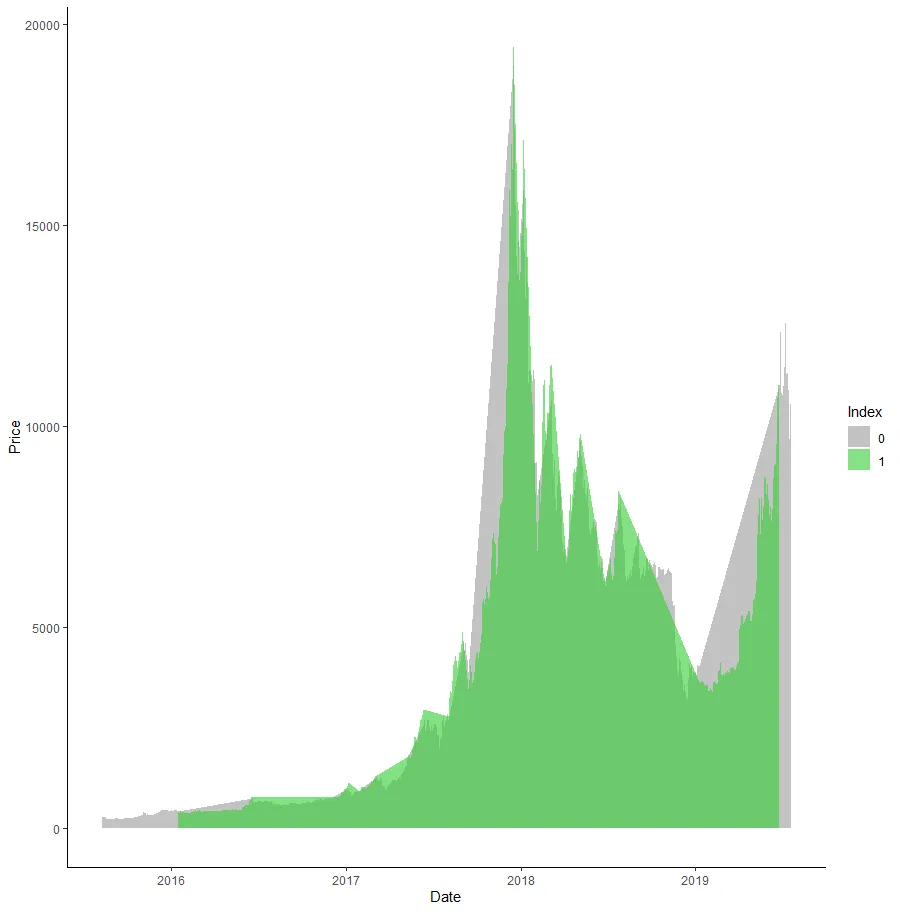
我也尝试过这个:
ggplot(plot.timeseries, aes(x=Date, y = Price, fill=Index)) +
  geom_area(alpha=0.6) +
  theme_classic() +
  scale_fill_manual(values=c("#999999", "#32CD32"))
结果是一团糟:
理想情况下,最终结果应该像plot1那样,其中绿色线的部分被填充。
时间序列数据可以在此处访问:
https://drive.google.com/file/d/1qWsuJk41_fJZktLCAZSgfGvoDLqTt-jk/view?usp=sharing
任何帮助将不胜感激!
geom_area()中使用ifelse()语句来实现曲线下方的填充。 - kstew