我的目标是使用R语言中的和函数,通过
lme4包中的变截距、变斜率多层模型计算预测值。为了使内容更加具体明确,我在这里提供了一个玩具示例,使用"mtcars"数据集:
以下是我通常从变截距、变斜率多层模型中创建预测值的方法(此代码应该可以正常工作):
# loading in-built cars dataset
data(mtcars)
# the "gear" column will be the group-level factor, so we'll have cars nested
# within "gear" type
mtcars$gear <- as.factor(mtcars$gear)
# fitting varying-slope, varying-intercept model
m <- lmer(mpg ~ 1 + wt + hp + (1 + wt|gear), data=mtcars)
# creating the prediction frame
newdata <- with(mtcars, expand.grid(wt=unique(wt),
gear=unique(gear),
hp=mean(hp)))
# calculating predictions
newdata$pred <- predict(m, newdata, re.form=~(1 + wt|gear))
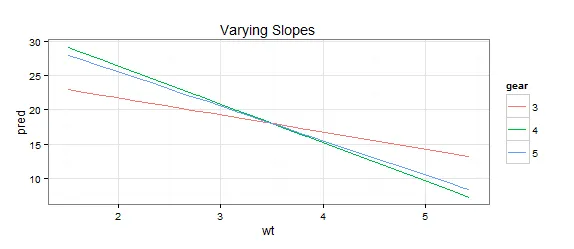
# quick ggplot2 graph
p <- ggplot(newdata, aes(x=wt, y=pred, colour=gear))
p + geom_line() + ggtitle("Varying Slopes")
以上 R 代码应该是可行的,但如果我想要创建和绘制来自非线性变化截距、变化斜率的预测,则显然会失败。为了简单和可重复性,这里使用“mtcars”数据集来说明问题:
# key question: how to create predictions if I want to examine a non-linear
# varying slope?

# creating a squared term for a non-linear relationship
# NB: usually I use the `poly` function
mtcars$wtsq <- (mtcars$wt)^2

# fitting varying-slope, varying-intercept model with a non-linear trend
m <- lmer(mpg ~ 1 + wt + wtsq + hp + (1 + wt + wtsq|gear), data=mtcars)

# creating the prediction frame
newdata <- with(mtcars, expand.grid(wt=unique(wt),
                                wtsq=unique(wtsq),
                                gear=unique(gear),
                                hp=mean(hp)))

# calculating predictions
newdata$pred <- predict(m, newdata, re.form=~(1 + wt + wtsq|gear))

# quick ggplot2 graph
# clearly not correct (see the graph below)
p <- ggplot(newdata, aes(x=wt, y=pred, colour=gear))
p + geom_line() + ggtitle("Varying Slopes")
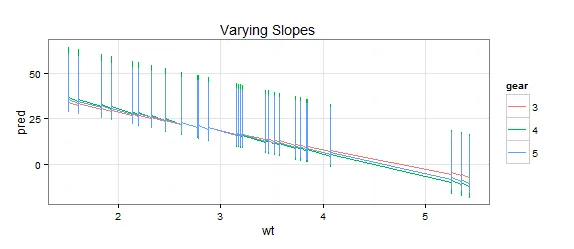
很明显,预测框架并未正确设置。有没有关于如何在使用R拟合非线性变截距、变斜率多层模型时创建和绘制预测值的想法呢?谢谢!