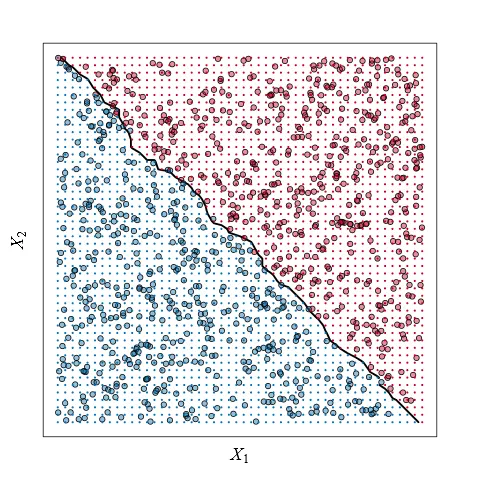
我在ISLR(图2.13)或ESL中发现了这张特别好的图。我无法猜出作者们是如何用R制作这张图的。我知道如何很容易地获得橙色和蓝色点。主要困惑在于背景点和紫色线。
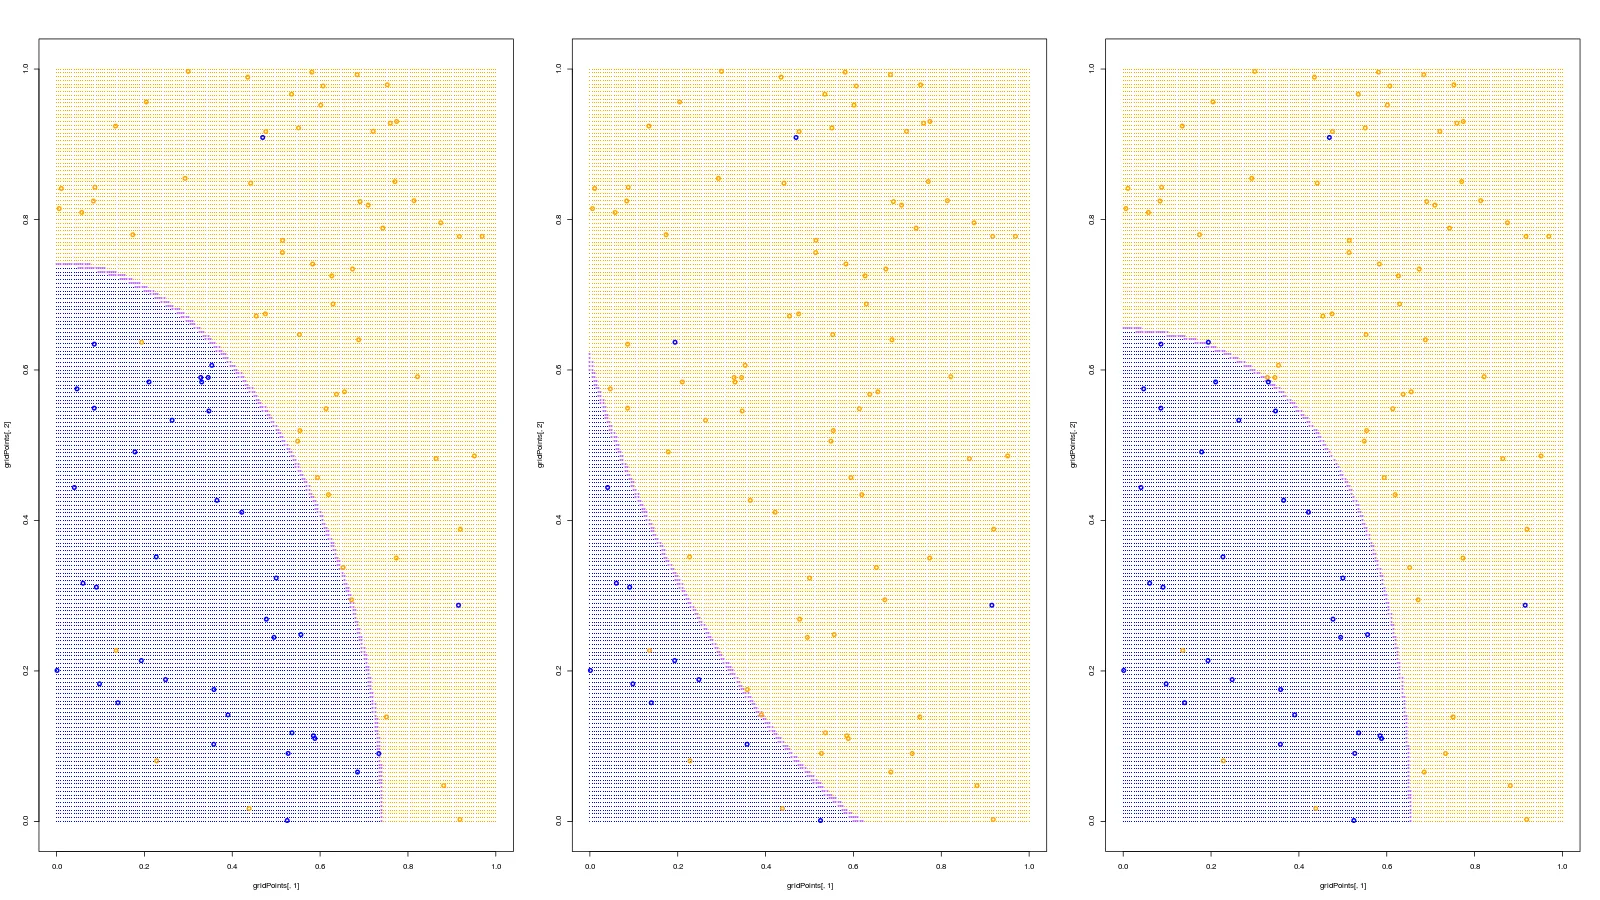
有什么想法吗?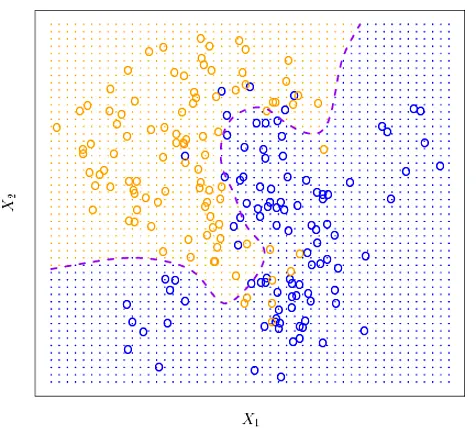 这里有一些示例代码,用灰色网格获取黄色和橙色点。如何获得任意非线性曲线,并根据曲线着色网格?
有什么想法吗?
这里有一些示例代码,用灰色网格获取黄色和橙色点。如何获得任意非线性曲线,并根据曲线着色网格?set.seed(pi)
points = replicate(100, runif(2))
pointsColored = ifelse(apply(points, 2, sum) <= 1, "orange", "blue")
# Confound some
pointsColored[sample.int(length(pointsColored), 10)] = "orange"
plot(x=points[1, ], y=points[2, ])
grid(nx=100, ny=100)
# Plot points over the grid.
points(x=points[1, ], y=points[2, ], col=pointsColored)