我该如何使用ggplot2绘制与contour(基本R)等效的图表?以下是使用线性判别函数分析的示例:
require(MASS)
iris.lda<-lda(Species ~ Sepal.Length + Sepal.Width + Petal.Length + Petal.Width, data = iris)
datPred<-data.frame(Species=predict(iris.lda)$class,predict(iris.lda)$x) #create data.frame
#Base R plot
eqscplot(datPred[,2],datPred[,3],pch=as.double(datPred[,1]),col=as.double(datPred[,1])+1)
#Create decision boundaries
iris.lda2 <- lda(datPred[,2:3], datPred[,1])
x <- seq(min(datPred[,2]), max(datPred[,2]), length.out=30)
y <- seq(min(datPred[,3]), max(datPred[,3]), length.out=30)
Xcon <- matrix(c(rep(x,length(y)),
rep(y, rep(length(x), length(y)))),,2) #Set all possible pairs of x and y on a grid
iris.pr1 <- predict(iris.lda2, Xcon)$post[, c("setosa","versicolor")] %*% c(1,1) #posterior probabilities of a point belonging to each class
contour(x, y, matrix(iris.pr1, length(x), length(y)),
levels=0.5, add=T, lty=3,method="simple") #Plot contour lines in the base R plot
iris.pr2 <- predict(iris.lda2, Xcon)$post[, c("virginica","setosa")] %*% c(1,1)
contour(x, y, matrix(iris.pr2, length(x), length(y)),
levels=0.5, add=T, lty=3,method="simple")
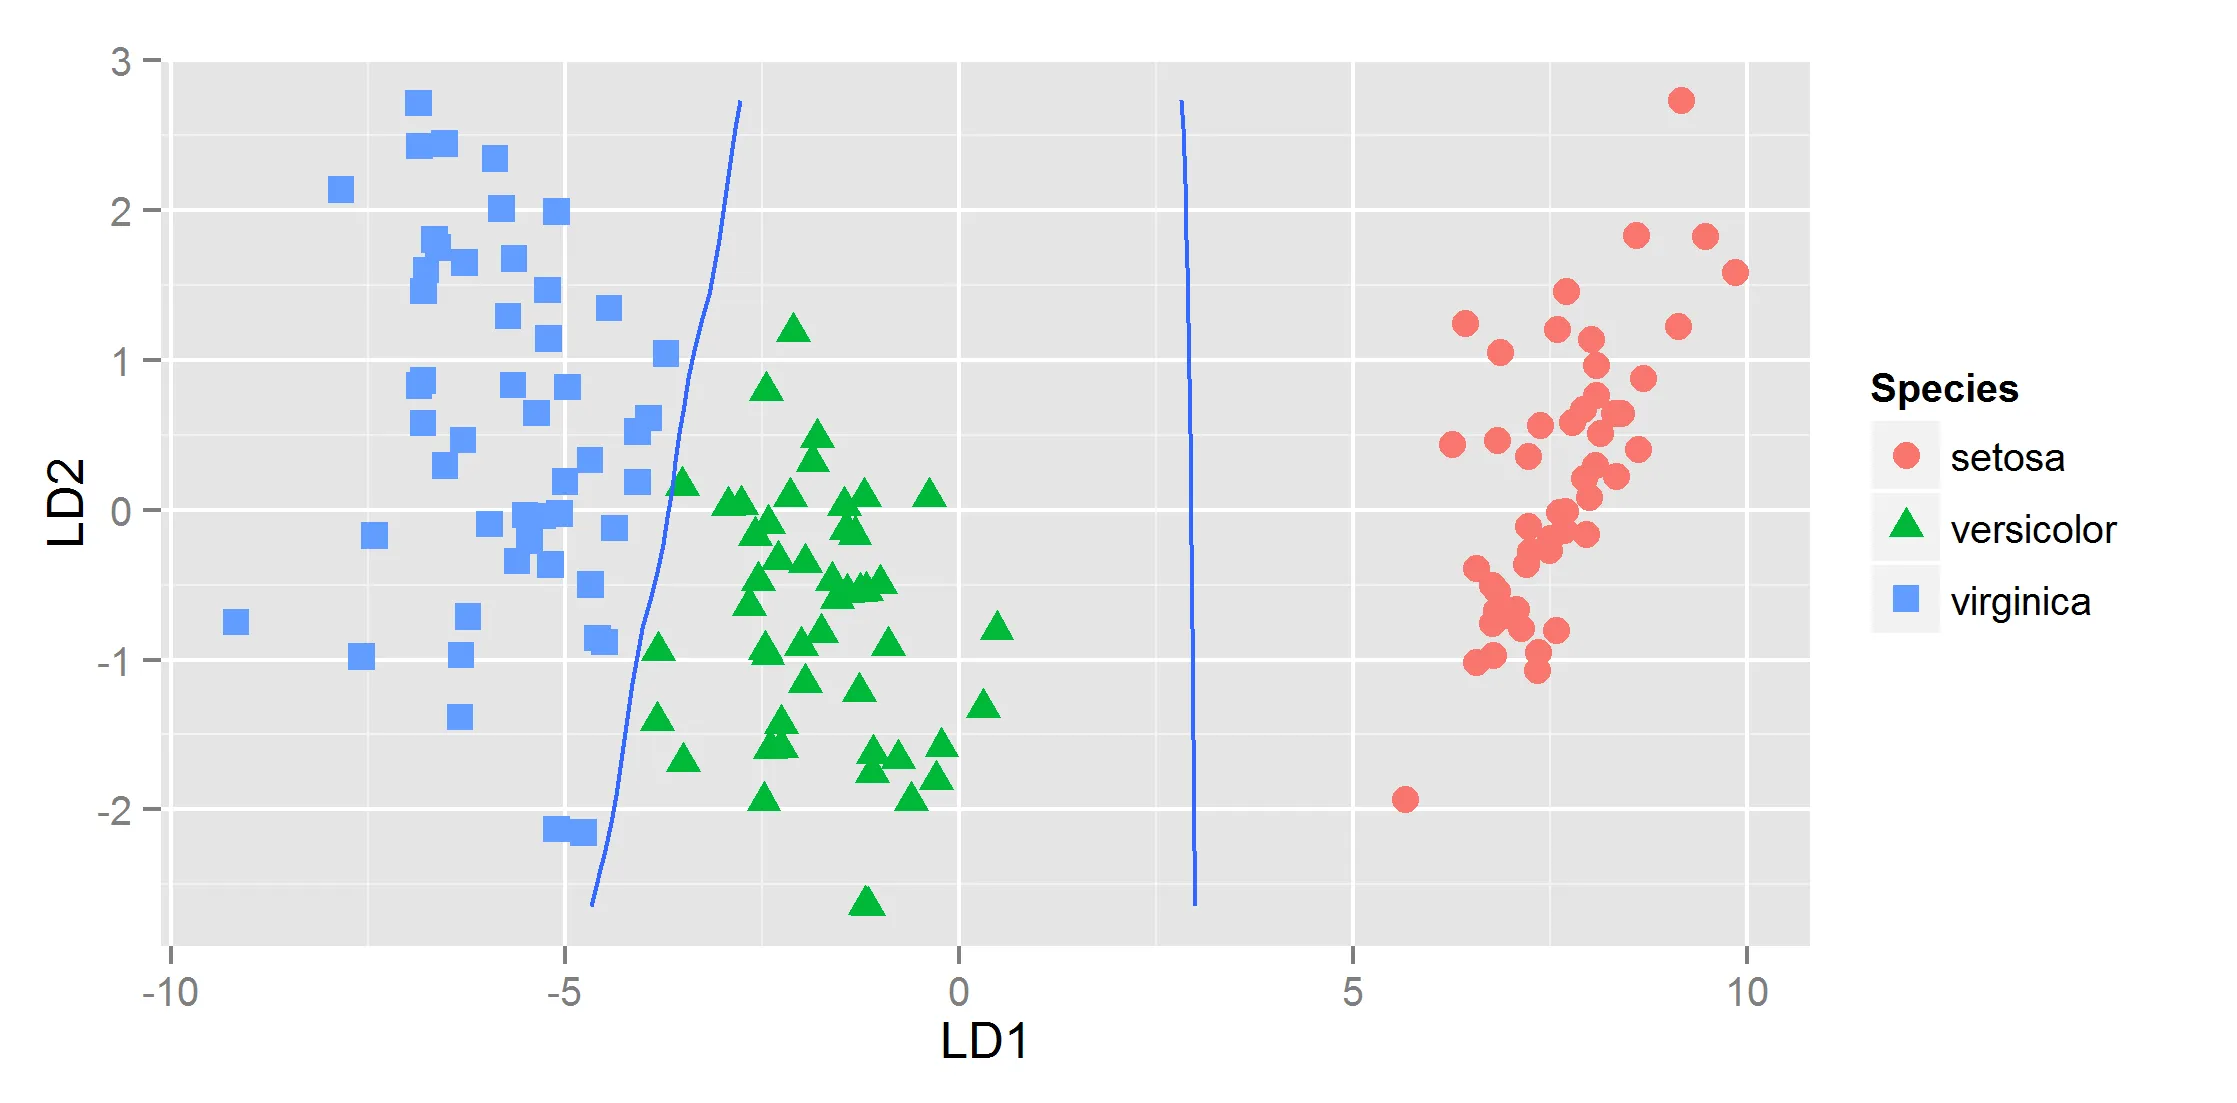
#Eqivalent plot with ggplot2 but without decision boundaries
ggplot(datPred, aes(x=LD1, y=LD2, col=Species) ) +
geom_point(size = 3, aes(pch = Species))
在使用ggplot绘制等高线时,无法使用矩阵。可以使用melt将矩阵重组为数据框。下面的数据框显示了来自iris.pr1的概率值在第一列中,并且x和y坐标在接下来的两列中显示。x和y坐标形成了一个30 x 30点的网格。
df <- transform(melt(matrix(iris.pr1, length(x), length(y))), x=x[X1], y=y[X2])[,-c(1,2)]
我希望绘制坐标点(最好用平滑曲线连接),其中后验概率为0.5(即决策边界)。