用ggplot2从Geotiff文件中绘制R地图背景

7

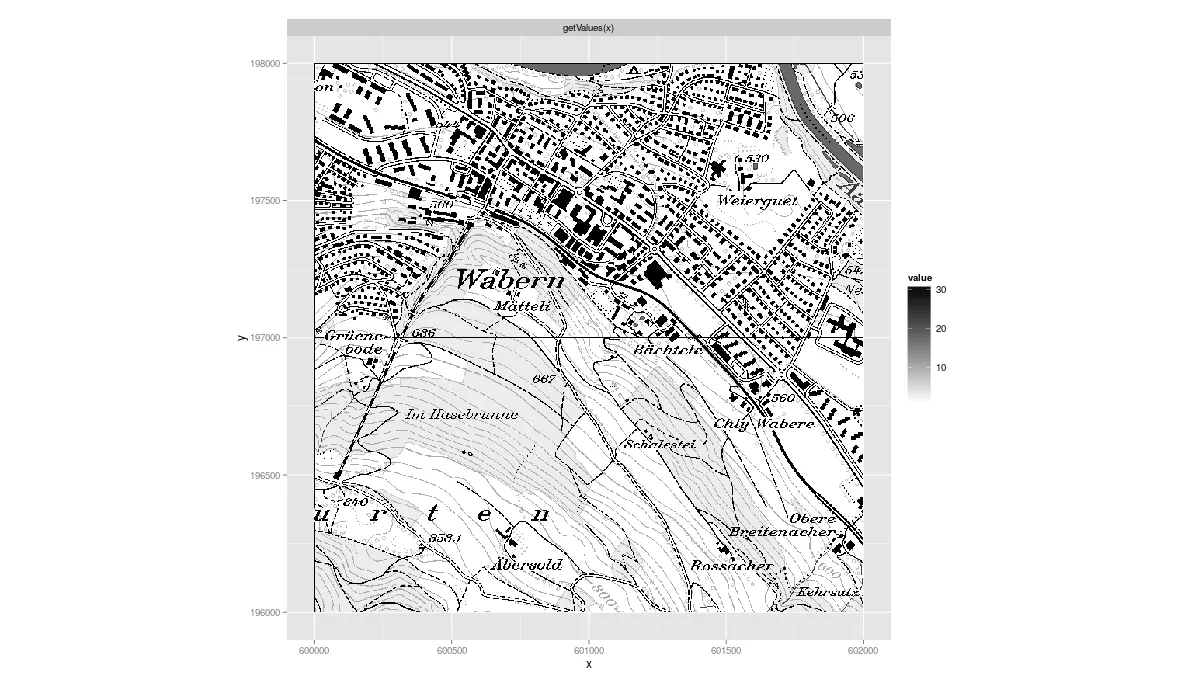
使用R基础绘图,可以通过以下命令绘制任何地理Tiff图像:

library("raster")
plot(raster("geo.tiff"))

比如,下载这个数据,我需要执行以下操作:

setwd("C:/download") # same folder as the ZIP-File
map <- raster("smr25musterdaten/SMR_25/SMR_25KOMB_508dpi_LZW/SMR25_LV03_KOMB_Mosaic.tif")

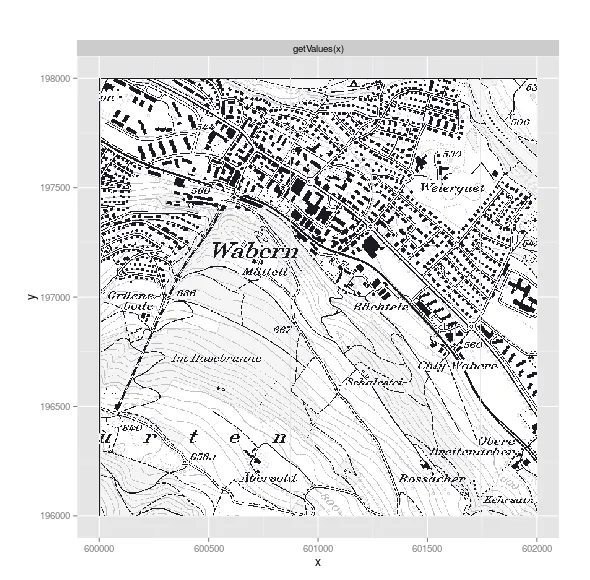
如何在ggplot2中绘制GeoTif文件?
编辑:
1:我已经用彩色地图替换了示例文件中的灰度地图,以说明缺少彩色表的问题。
2:在Pascal的帮助下,我能够改进这个解决方案并使其更加动态适应输入tif。我将在下面发布答案。
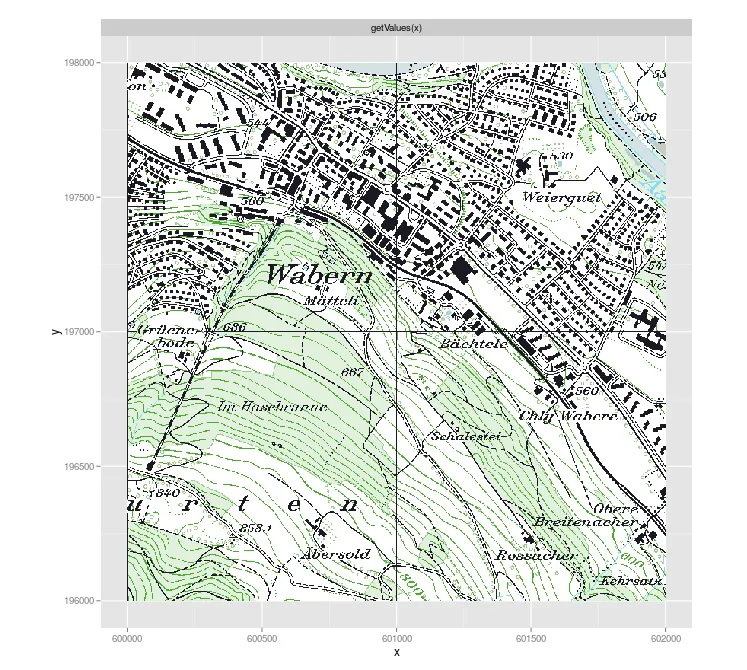
使用您的示例,我在 map@legend@colortable 中获取了一个颜色表(266个值)。请问您用的是哪个操作系统和 sessionInfo 信息? - user3710546
@Pascal:昨天晚上一定很晚了... map@legend@colortable 可以使用,colortable(map) 也可以。 - Ratnanil
3个回答

7
这里有一种使用 rasterVis 包中的 gplot 函数的替代方法。
library(rasterVis)
library(ggplot2)
setwd("C:/download") # same folder as the ZIP-File
map <- raster("smr25musterdaten/SMR_25/SMR_25KGRS_508dpi_LZW/SMR25_LV03_KGRS_Mosaic.tif")

gplot(map, maxpixels = 5e5) + 
  geom_tile(aes(fill = value)) +
  facet_wrap(~ variable) +
  scale_fill_gradient(low = 'white', high = 'black') +
  coord_equal()

在此输入图片描述

如果您想使用颜色表:

coltab <- colortable(map)
coltab <- coltab[(unique(map))+1]

gplot(map, maxpixels=5e5) + 
  geom_tile(aes(fill = value)) +
  facet_wrap(~ variable) +
  scale_fill_gradientn(colours=coltab, guide=FALSE) +
  coord_equal()

这里输入图片描述

加上颜色:

这里输入图片描述


谢谢你提供的解决方案!不过我有两个问题:1. 你手动使用 scale_fill_gradient(low = 'white', high = 'black') 来设置填充颜色。这在我有彩色地图时行不通。2. 我很想使用 ggplot 而不是 gplot,因为我需要向底图添加额外的数据。 - Ratnanil
gplotggplot的一个包装器,如果你看了帮助页面...你觉得为什么要加载ggplot2 - user3710546
好的,我的错,我很抱歉 :-/ 不过问题1还存在.. 我正在尝试使用Florian R. Klein在Stack Overflow上提供的链接问题/答案来解决它(https://dev59.com/B3fZa4cB1Zd3GeqPUKIb)。我将编辑/重新表述我的原始问题。 - Ratnanil
在示例数据中运作得非常好,谢谢!奇怪的是,在我现在使用的数据上并不能完全正常工作,这些数据是我提供的示例数据的更旧版本。因此,我会将我的答案留在那里,供需要我稍微长一点的解决方案的人使用。 - Ratnanil

1

就像我在原问题中指出的那样,我能够通过使用帕斯卡尔的输入和this solution来解决问题。这是颜色正确的方法:

library(rasterVis) # in order to use raster in ggplot
setwd("C:/download") # same folder as the ZIP-File

map <- raster("smr25musterdaten/SMR_25/SMR_25KOMB_508dpi_LZW/SMR25_LV03_KOMB_Mosaic.tif") # sample data from [here][2]

# turn raster into data.frame and copy the colortable
map.df <- data.frame(rasterToPoints(map))
colTab <- colortable(map)

# give the colors their apropriate names:
names(colTab) <- 0:(length(colTab) - 1) 

# only define the colors used in the raster image
from <- min(map.df[[3]], na.rm = T)+1 
to <- max(map.df[[3]], na.rm = T)+1
used_cols <- colTab[from:to] 

# plot:
gplot(map, maxpixels = 5e5) +
  facet_wrap(~ variable) +
  geom_tile(aes(fill = value)) +
  scale_fill_gradientn(colours=used_cols) +
  coord_equal()

1
对于未来的用户,我想指出这3个解决方案都不适用于我。我不确定为什么;颜色标签总是填满了NAs。然而,我在这里找到了一个解决方案:https://gis.stackexchange.com/questions/102788/r-plot-raster-with-real-colors。可以在plotRGB()之后使用plot( , add=TRUE)将shapefile对象层叠在RasterStack上。也可以为RasterStack指定范围,并像处理普通图层一样裁剪或屏蔽它。 - Leah Bevis

1
我已经改进了解决方案,并创建了一个小函数,可以直接导入到ggplot中(还有将其转换为灰度的整洁选项)。
require(rasterVis)
require(raster)
require(ggplot2)

setwd("C:/download") # same folder as the ZIP-File
map <- raster("smr25musterdaten/SMR_25/SMR_25KOMB_508dpi_LZW/SMR25_LV03_KOMB_Mosaic.tif")

# Function to get the colourtable with the option of returing it in greyscale
getColTab <- function(rasterfile, greyscale = F){
  colTab <- raster::colortable(rasterfile)
  if(greyscale == T){
    colTab <- col2rgb(colTab)
    colTab <- colTab[1,]*0.2126 + colTab[2,]*0.7152 + colTab[3,]*0.0722
    colTab <- rgb(colTab,colTab,colTab, maxColorValue = 255)
  }
  names(colTab) <- 0:(length(colTab)-1)
  return(colTab)
}

gplot(map, maxpixels = 10e5) +
  geom_tile(aes(fill = factor(value))) +
  scale_fill_manual(values = getColTab(map),guide = "none") +
  coord_equal() 

网页内容由stack overflow 提供, 点击上面的
可以查看英文原文,
原文链接