R ggplot2绘制小时数据

18
我正在尝试使用ggplot2绘制来自气象站的每小时气象数据(这是我第一次使用ggplot)。我已经成功地绘制了日数据,但在将其降至小时级别时遇到了一些问题。数据文件看起来像这样:
FECHA H_SOLAR;DIR_M;VEL_M;TEMP_M;HR;PRECIP
01/06/14 00:50:00;314.3;1.9;14.1;68.0;-99.9
01/06/14 01:50:00;322.0;1.6;13.3;68.9;-99.9
01/06/14 02:50:00;303.5;2.1;12.3;70.9;-99.9
01/06/14 03:50:00;302.4;1.6;11.6;73.1;-99.9
01/06/14 04:50:00;306.5;1.2;10.9;76.4;-99.9
01/06/14 05:50:00;317.1;0.8;12.6;71.5;-99.9
01/06/14 06:50:00;341.8;0.0;17.1;58.8;-99.9
01/06/14 07:50:00;264.6;1.2;21.8;44.9;-99.9
01/06/14 08:50:00;253.8;2.9;24.7;32.2;-99.9
01/06/14 09:50:00;254.6;3.7;26.7;27.7;-99.9
01/06/14 10:50:00;250.7;4.3;28.3;24.9;-99.9
01/06/14 11:50:00;248.5;5.3;29.1;22.6;-99.9
01/06/14 12:50:00;242.8;4.7;30.3;20.4;-99.9
01/06/14 13:50:00;260.7;4.9;31.3;17.4;-99.9
01/06/14 14:50:00;251.8;5.1;31.9;17.1;-99.9
01/06/14 15:50:00;258.1;4.6;32.4;15.3;-99.9
01/06/14 16:50:00;254.3;5.7;32.4;14.0;-99.9
01/06/14 17:50:00;252.5;4.6;32.0;14.1;-99.9
01/06/14 18:50:00;257.4;3.8;31.1;14.9;-99.9
01/06/14 19:50:00;135.8;4.2;26.0;41.2;-99.9
01/06/14 20:50:00;126.0;1.7;23.5;48.7;-99.9
01/06/14 21:50:00;302.8;0.7;21.6;53.9;-99.9
01/06/14 22:50:00;294.2;1.1;19.3;67.4;-99.9
01/06/14 23:50:00;308.5;1.0;17.5;72.4;-99.9

我使用了以下R命令绘制数据:

datos=read.csv("utiel.dat",sep=";",header=T,na.strings="-99.9")

dia=as.Date(datos[,1],"%y/%m/%d")       # Crear índice dia
veloc=zoo(datos[,c("VEL_M")],dia)       

gveloc=ggplot(data=datos,aes(dia,veloc))

gveloc + geom_point(colour="blue",cex=1) + ylab("Velocidad (km/h)") + xlab("Fecha") + opts(title="Velocidad media horaria") + scale_x_date(limits = as.Date(c("2007-01-01","2007-01-31")),format = "%Y-%m-%d")

我得到了这个月度图表,其中包含来自同一天的所有数据,x坐标相同(即与预期相同的那一天)

Hourly wind data with ggplot2

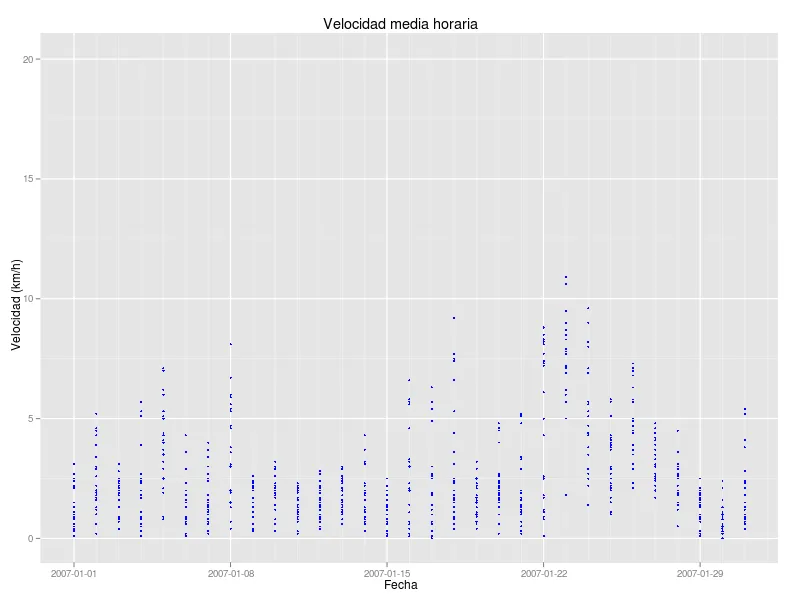
我该如何读取日期和时间,以便每个点都可以在自己的x/时间坐标中绘制?我认为问题在绘图之前开始,但我找不到如何将日期读取为YY/MM/DD H:M:S

提前感谢

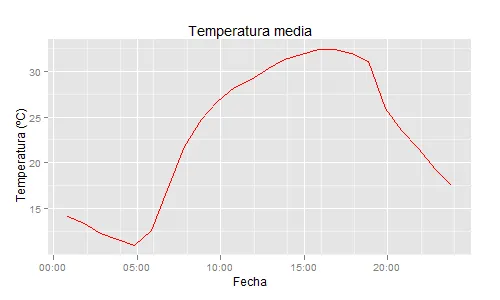
解决方案:只需添加以下代码即可使代码正常运行

 datos$dia=as.POSIXct(datos[,1], format="%y/%m/%d %H:%M:%S")  # Read date/time as POSIXct

 ggplot(data=datos,aes(x=dia, y=TEMP_M)) + 
   geom_point(colour="red") + 
   ylab("Temperatura (ºC)") + 
   xlab("Fecha") + 
   opts(title="Temperatura media") + 
   scale_x_datetime(limits=c(as.POSIXct('2008/02/01'), as.POSIXct('2008/02/02')) ,format =  "%Y-%m-%d")

希望这能对其他人有所帮助,感谢 Andrie 和 G.Grothendieck。


嗨,我看不到你的完整评论。 - pacomet
2个回答

13

as.Date 只能获取日期部分。要获取时间,需要使用 as.POSIXct

重新创建你的数据:

zz <- tempfile()
cat("
FECHA H_SOLAR;DIR_M;VEL_M;TEMP_M;HR;PRECIP
01/06/14 00:50:00;314.3;1.9;14.1;68.0;-99.9
01/06/14 01:50:00;322.0;1.6;13.3;68.9;-99.9
01/06/14 02:50:00;303.5;2.1;12.3;70.9;-99.9
01/06/14 03:50:00;302.4;1.6;11.6;73.1;-99.9
01/06/14 04:50:00;306.5;1.2;10.9;76.4;-99.9
01/06/14 05:50:00;317.1;0.8;12.6;71.5;-99.9
01/06/14 06:50:00;341.8;0.0;17.1;58.8;-99.9
01/06/14 07:50:00;264.6;1.2;21.8;44.9;-99.9
01/06/14 08:50:00;253.8;2.9;24.7;32.2;-99.9
01/06/14 09:50:00;254.6;3.7;26.7;27.7;-99.9
01/06/14 10:50:00;250.7;4.3;28.3;24.9;-99.9
01/06/14 11:50:00;248.5;5.3;29.1;22.6;-99.9
01/06/14 12:50:00;242.8;4.7;30.3;20.4;-99.9
01/06/14 13:50:00;260.7;4.9;31.3;17.4;-99.9
01/06/14 14:50:00;251.8;5.1;31.9;17.1;-99.9
01/06/14 15:50:00;258.1;4.6;32.4;15.3;-99.9
01/06/14 16:50:00;254.3;5.7;32.4;14.0;-99.9
01/06/14 17:50:00;252.5;4.6;32.0;14.1;-99.9
01/06/14 18:50:00;257.4;3.8;31.1;14.9;-99.9
01/06/14 19:50:00;135.8;4.2;26.0;41.2;-99.9
01/06/14 20:50:00;126.0;1.7;23.5;48.7;-99.9
01/06/14 21:50:00;302.8;0.7;21.6;53.9;-99.9
01/06/14 22:50:00;294.2;1.1;19.3;67.4;-99.9
01/06/14 23:50:00;308.5;1.0;17.5;72.4;-99.9
", file=zz)

datos=read.csv(zz, sep=";", header=TRUE, na.strings="-99.9")

将日期转换为 POSIXct 并打印:

library(ggplot2)

datos=read.csv(zz, sep=";", header=TRUE, na.strings="-99.9")

datos$dia=as.POSIXct(datos[,1], format="%y/%m/%d %H:%M:%S")  

ggplot(data=datos,aes(x=dia, y=TEMP_M)) + 
  geom_path(colour="red") + 
  ylab("Temperatura (ºC)") + 
  xlab("Fecha") + 
  opts(title="Temperatura media") 

输入图像说明


很好的回答Andrie,谢谢。对于我发布的日常数据,它可以正常工作,但问题在于我的数据跨越了十年。然后,我需要设置set_x_scale选项以选择要绘制的时间段(从日到月)。我无法为一个月重新创建图形。是否有必要重新创建数据? - pacomet
你需要指定你的限制范围,同时使用POSIXct日期而不是as Date - Andrie
我该如何将 POSIXct 设置为限制?或许可以像这样:scale_x_date(limits = as.POSIXct(c("2004-01-01", "2005-01-01")), format = "%Y-%m-%d")?谢谢。 - pacomet
嗨,我终于找到了如何将x轴限制设置为POSIX.ct的方法。非常感谢你的帮助。 - pacomet

6

由于您正在使用zoo,因此我们可以使用read.zoo来设置数据z,然后使用plot.zooxyplot.zoo或ggplot2的qplot进行绘制。我们以下展示了这三种方法。

Lines <- "FECHA H_SOLAR;DIR_M;VEL_M;TEMP_M;HR;PRECIP
01/06/14 00:50:00;314.3;1.9;14.1;68.0;-99.9
01/06/14 01:50:00;322.0;1.6;13.3;68.9;-99.9
01/06/14 02:50:00;303.5;2.1;12.3;70.9;-99.9
01/06/14 03:50:00;302.4;1.6;11.6;73.1;-99.9
01/06/14 04:50:00;306.5;1.2;10.9;76.4;-99.9
01/06/14 05:50:00;317.1;0.8;12.6;71.5;-99.9
01/06/14 06:50:00;341.8;0.0;17.1;58.8;-99.9
01/06/14 07:50:00;264.6;1.2;21.8;44.9;-99.9
01/06/14 08:50:00;253.8;2.9;24.7;32.2;-99.9
01/06/14 09:50:00;254.6;3.7;26.7;27.7;-99.9
01/06/14 10:50:00;250.7;4.3;28.3;24.9;-99.9
01/06/14 11:50:00;248.5;5.3;29.1;22.6;-99.9
01/06/14 12:50:00;242.8;4.7;30.3;20.4;-99.9
01/06/14 13:50:00;260.7;4.9;31.3;17.4;-99.9
01/06/14 14:50:00;251.8;5.1;31.9;17.1;-99.9
01/06/14 15:50:00;258.1;4.6;32.4;15.3;-99.9
01/06/14 16:50:00;254.3;5.7;32.4;14.0;-99.9
01/06/14 17:50:00;252.5;4.6;32.0;14.1;-99.9
01/06/14 18:50:00;257.4;3.8;31.1;14.9;-99.9
01/06/14 19:50:00;135.8;4.2;26.0;41.2;-99.9
01/06/14 20:50:00;126.0;1.7;23.5;48.7;-99.9
01/06/14 21:50:00;302.8;0.7;21.6;53.9;-99.9
01/06/14 22:50:00;294.2;1.1;19.3;67.4;-99.9
01/06/14 23:50:00;308.5;1.0;17.5;72.4;-99.9"
cat(Lines, "\n", file = "data.txt")

library(zoo)
z <- read.zoo("data.txt", header = TRUE, sep = ";", na.strings = "-99.9", 
        tz = "", format = "%y/%m/%d %H:%M:%S")
# move last 12 points into following day
time(z)[13:24] <- time(z)[13:24] + 24 * 60 * 60
xlim <- as.POSIXct(c("2001-06-14 00:00:00", "2001-06-14 12:00:00"))

这里有三种绘制它的方法: 1 - 经典图形 使用 plot.zoo
# Create manual axis since classic graphic's default is not so good.
# Axis might be ok for real data in which case manual axis setting can be omitted
plot(z$VEL_M, type = "p", xlab = "X", ylab = "Y", col = "blue", xlim = xlim,
    xaxt = "n")
xaxis <- seq(xlim[1], xlim[2], by = "hour")
axis(1, xaxis, as.POSIXlt(xaxis)$hour)

2 - 格子图使用xyplot.zoo

library(lattice)
xyplot(z$VEL_M, type = "p", xlab = "X", ylab = "Y", col = "blue", xlim = xlim)

3 - ggplot2 使用 qplot

# unlike classic graphics and lattice graphics, zoo currently 
# does not have a specific interface but we can do this:
library(ggplot2)
qplot(time(z), z$VEL_M, xlab = "X", ylab = "Y") + 
    geom_point(colour = "blue") +
    scale_x_datetime(limits = xlim)

编辑:

修改示例以说明如何限制X轴。


你好,感谢您的回答。我已经尝试了ggplot2选项,并且对整个数据集都有效,但是当我尝试设置x轴限制时,无法生成图形。我尝试使用scale_x_date(limits = as.Date(c("2007-01-01","2007-01-31")),format = "%Y-%m-%d"),然后没有任何点出现,x轴限制被很好地定义,但是没有数据。R显示“删除了105192行包含缺失值的数据(geom_point)”。有什么想法吗? - pacomet
再次你好。我已经接受了其他答案,因为它帮助我理解了POSIXct日期和时间格式,但是你的回答也很有帮助。 - pacomet
1
@pacomet。已修改示例以说明限制X轴。 - G. Grothendieck

网页内容由stack overflow 提供, 点击上面的
可以查看英文原文,
原文链接