matplotlib是否存在在子图中定义子图网格的功能?

4
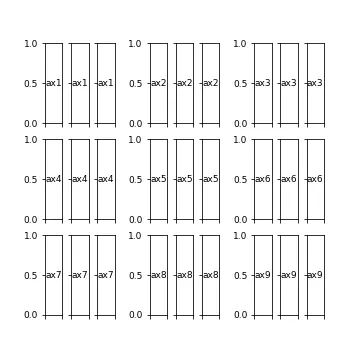
我有一个需要使用的图表布局,其中9个不同的数据簇被放置在一个正方形网格上。 网格中的每个框包含3个并排放置的箱形图。
我的最初想法是这适合3x3子图布局,每个单独的子图本身分为3x1子图布局。
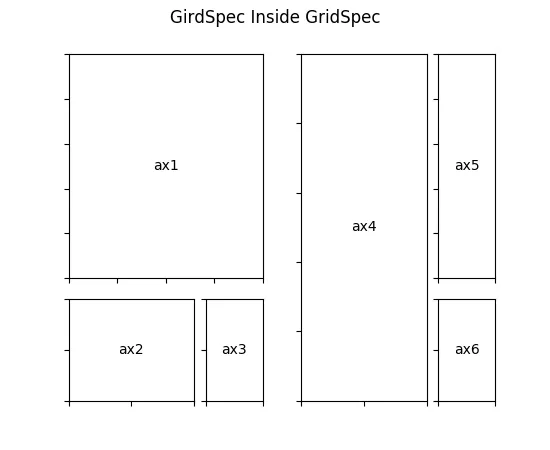
我看到了这个:在matplotlib中嵌入小图,它似乎允许您在子图中定义单独的手动放置的绘图。 但是,将子图空间递归地分割成<10个易于处理的子图网格的想法似乎是如此显而易见的想法,以至于我无法相信它没有直接实现。
2个回答

6
我认为嵌套的gridspec示例这里是您正在寻找的内容。
我已将它们的示例改编成您描述的网格模式的模型,使用gridspec创建了一个轴列表,然后迭代它们的索引来填充它们。这种方法应该符合您需要的“3x3子图布局,每个单独的子图本身被分成一个3x1子图布局”的要求。
import matplotlib as mpl
from matplotlib import gridspec
from matplotlib import pyplot as plt

f= plt.figure(figsize=(5, 5))
gs = gridspec.GridSpec(3, 3, wspace=0.5, hspace=0.2) #these are the 9 clusters

for i in range(9):
    nested_gs = gridspec.GridSpecFromSubplotSpec(1, 3, subplot_spec=gs[i], wspace=0.5) # 1 row, 3 columns for each cluster

    for j in range(3): #these are the 3 side by side boxplots within each cluster
        ax = plt.Subplot(f, nested_gs[j])
        ax.text(0.5, 0.5, "ax%d" % (i+1), va="center", ha="center", fontsize=9)
        
        #ax.boxplot(data) # this is where you'd add your boxplots to the axes
        
        # the following just cleans up each axes for readability
        for tl in ax.get_xticklabels():
            tl.set_visible(False)
        for tl in ax.get_yticklabels():
            tl.set_visible(False)
            if ax.is_first_col():
                tl.set_visible(True)
                tl.set_fontsize(9)
        f.add_subplot(ax)

f.savefig('nested_subplot.png')

我希望这可以帮助你开始。
编辑以包括图像:

enter image description here


2
Matplotlib拥有一个扁平的层次结构。你有一个图形,里面有一个不确定和未绑定数量的坐标轴。因此,子图的子图不存在。但是你当然可以将坐标轴放置在其他子图中看起来像是嵌入在其他子图中。
但是可以使用几个子图网格层。这在gridspec指南中详细介绍。你可能特别感兴趣的是使用GridSpecFromSubplotSpec,它允许生成这个例子。
gs0 = gridspec.GridSpec(1, 2)

gs00 = gridspec.GridSpecFromSubplotSpec(3, 3, subplot_spec=gs0[0])
gs01 = gridspec.GridSpecFromSubplotSpec(3, 3, subplot_spec=gs0[1])

enter image description here


谢谢Ernest,我会研究一下 - 起初我不清楚发布的代码是如何导致下面的轴布局的,但我会仔细看看,感谢您的指引。 - Thomas Kimber

网页内容由stack overflow 提供, 点击上面的
可以查看英文原文,
原文链接