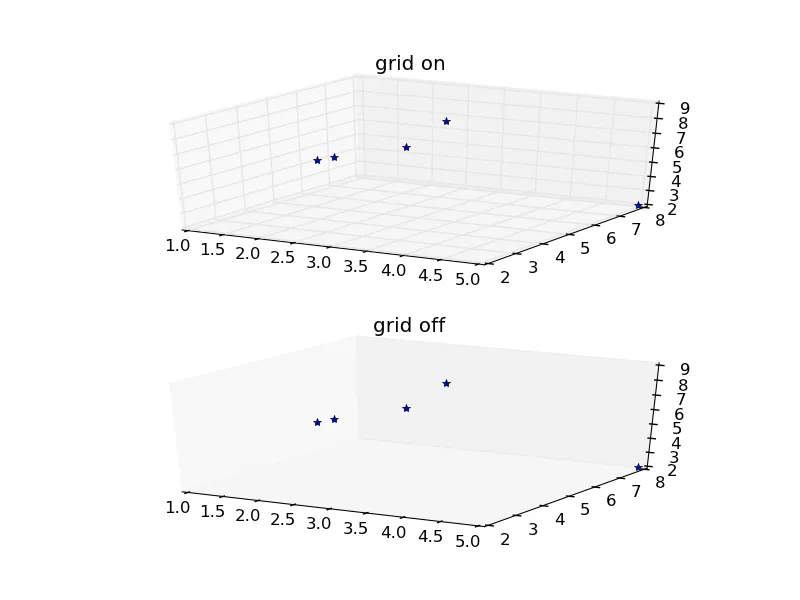
Matplotlib:三维图中的网格

3
matplotlib 中,如何在 3D 散点图中显示网格?
在2D图中,我只需要使用 plt.grid(True),这样就可以轻松显示网格。但是在3D图中,相同的调用会返回一个警告:
File "/usr/lib/pymodules/python2.7/matplotlib/pyplot.py", line 2792, in grid
   ret = gca().grid(b, which, axis, **kwargs)    
TypeError: grid() takes at most 2 arguments (4 given)

我该怎么做?

1个回答

5
您可以使用坐标轴的网格方法来控制网格的开启和关闭。
import matplotlib.pyplot as plt
from mpl_toolkits.mplot3d import Axes3D

fig = plt.figure()
ax = fig.add_subplot(211, projection='3d')
ax.plot([1,2,3,4,5],[7,4,6,2,8],[4,6,8,9,2],'*')
ax.grid(True)
ax.set_title('grid on')

ax2 = fig.add_subplot(212, projection='3d')
ax2.plot([1,2,3,4,5],[7,4,6,2,8],[4,6,8,9,2],'*')
ax2.grid(False)
ax2.set_title('grid off')
plt.show()

3d plot with and without grid


1
哦,好的,谢谢。那我猜它默认是开启的。事实证明,在三维图中正确识别三个坐标并不像可能有用。你知道任何其他方法可以清晰地显示每个绘制点的三个坐标吗? - Ricky Robinson
2
我想你可以给每个点或关键点打上标签。否则不行。 - Molly
@RickyRobinson 你可以尝试生成立体对。 - tacaswell

网页内容由stack overflow 提供, 点击上面的
可以查看英文原文,
原文链接