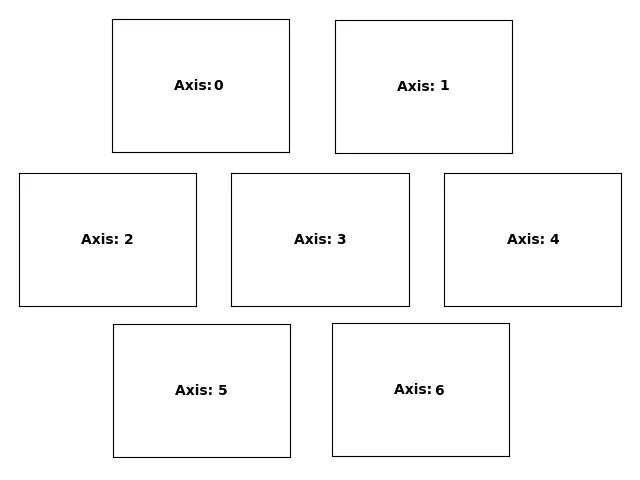
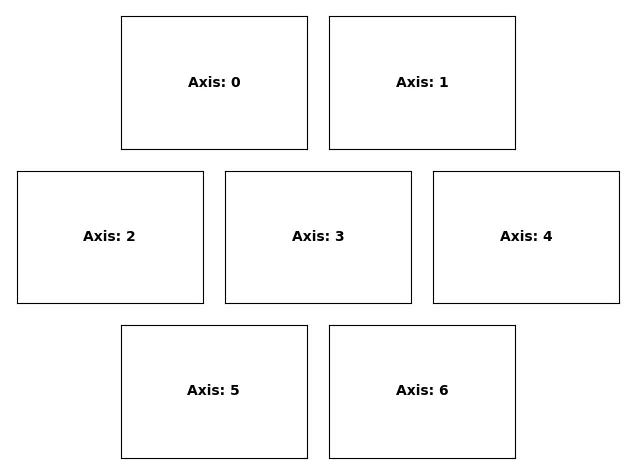
使用matplotlib,我想在一个网格上显示多个子图,每行的列数不同,每个子图大致相同大小,并且子图排列使它们更或多或少地居中,就像这样:
我知道可以设置一堆子图并通过计算几何形状来调整它们的排列,但我认为这可能会变得有点复杂,所以我希望可能有更简单的方法可用。
需要注意的是,即使我在示例中使用了(2, 3, 2)的排列,我也想为任意集合执行此操作,而不仅仅是这一个。
gridspec创建具有2、3、2模式的网格相当简单,但问题在于gridspec会将它们对齐到网格上,因此具有2个图的行中的图形更宽:
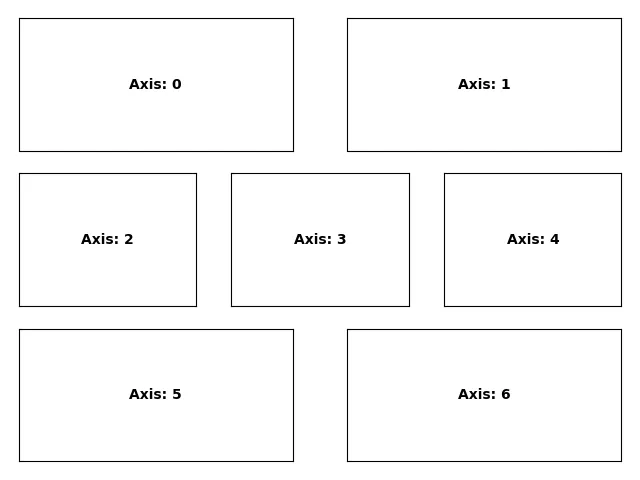
from matplotlib import gridspec
from matplotlib import pyplot as plt

fig = plt.figure()

arrangement = (2, 3, 2)
nrows = len(arrangement)

gs = gridspec.GridSpec(nrows, 1)
ax_specs = []
for r, ncols in enumerate(arrangement):
    gs_row = gridspec.GridSpecFromSubplotSpec(1, ncols, subplot_spec=gs[r])
    for col in range(ncols):
        ax = plt.Subplot(fig, gs_row[col])
        fig.add_subplot(ax)

for i, ax in enumerate(fig.axes):
    ax.text(0.5, 0.5, "Axis: {}".format(i), fontweight='bold',
            va="center", ha="center")
    ax.tick_params(axis='both', bottom='off', top='off', left='off',
                   right='off', labelbottom='off', labelleft='off')

plt.tight_layout()
我知道可以设置一堆子图并通过计算几何形状来调整它们的排列,但我认为这可能会变得有点复杂,所以我希望可能有更简单的方法可用。
需要注意的是,即使我在示例中使用了(2, 3, 2)的排列,我也想为任意集合执行此操作,而不仅仅是这一个。
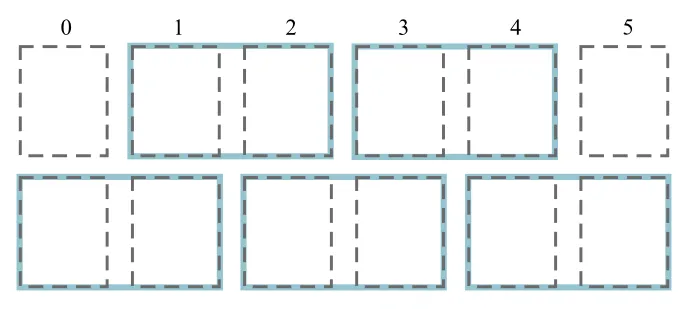
n * 2网格即可,因此非常简单。 - Paul