使用库
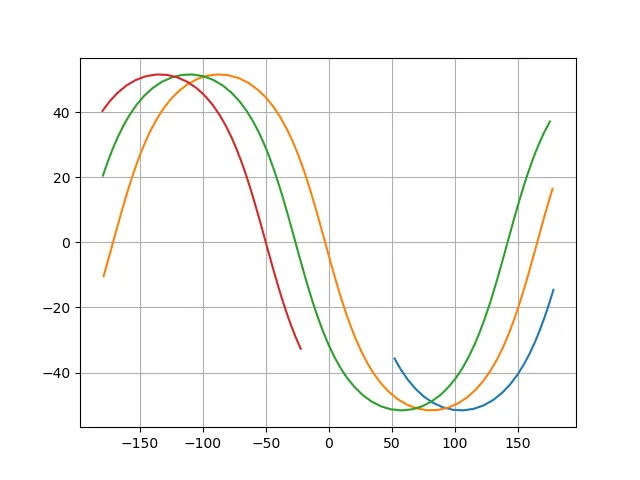
以下是我目前拥有的代码和得到的图形。
pyephem,我想找到一种方法来做出一个漂亮的图表(经度,纬度)曲线,表示卫星的地面轨迹。我已经计算出了(经度,纬度),但当经度超过+180°时,下一个计算出的值为-178°,这样就会绘制一个线段,使图形变得不好看。以下是我目前拥有的代码和得到的图形。
currentDate = date.datetime(2018,12,1,0,0,0);

for i in range(nPoints):
  iss.compute(currentDate)
  # compute latitude
  posLat[i] = iss.sublat*(180/math.pi)
  # compute longitude
  posLong[i] = iss.sublong*(180/math.pi)
  currentDate = currentDate + date.timedelta(seconds = (time3orbits/nPoints*3600))
  print currentDate, posLong[i], posLat[i]

plt.plot(posLong,posLat)
plt.show()
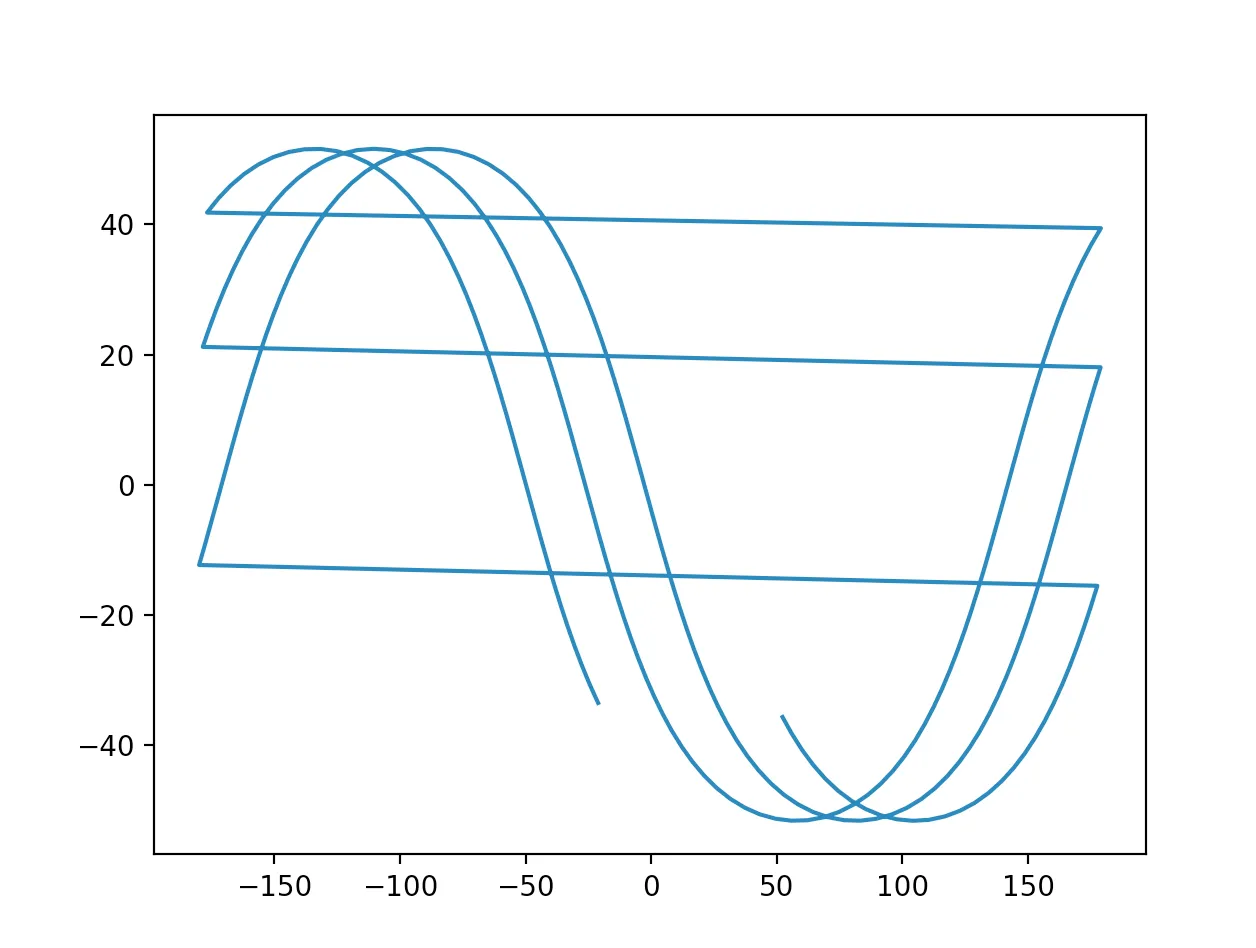
这是我得到的数字(绕地球3次):
iss.sublat 和 iss.sublong 分别是国际空间站当前位置的纬度和经度(以固定的 currentDate 为基准)。