NetworkX中的曲线边界

3

我目前有以下代码用于我的networkx图:

import matplotlib.pyplot as plt
import networkx as nx


g = nx.Graph()
# add edges
g.add_edge("a", "b", weight=0.6)
g.add_edge("a", "c", weight=0.2)
g.add_edge("c", "d", weight=0.1)
g.add_edge("c", "e", weight=0.7)
g.add_edge("c", "f", weight=0.9)
g.add_edge("a", "d", weight=0.3)
# group edges by attribute "weight"
elarge = [
    (u, v) for (u, v, d) in g.edges(data=True)
    if d["weight"] > 0.5]
esmall = [
    (u, v) for (u, v, d) in g.edges(data=True)
    if d["weight"] <= 0.5]
# compute the positions of nodes
pos = nx.circular_layout(g)
# plot the graph nodes
nx.draw_networkx_nodes(g, pos, node_size=700)
# plot the graph edges
nx.draw_networkx_edges(g, pos, edgelist=elarge, width=6)
nx.draw_networkx_edges(
    g, pos, edgelist=esmall, width=6,
    alpha=0.5, edge_color="b", style="dashed")
# annotate the nodes
nx.draw_networkx_labels(
    g, pos, font_size=20, font_family="sans-serif")
# graphics config
plt.axis("off")
plt.show()  # wait before exiting

以下是输出结果:enter image description here

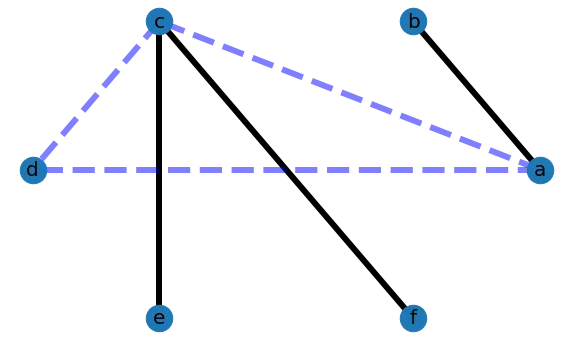
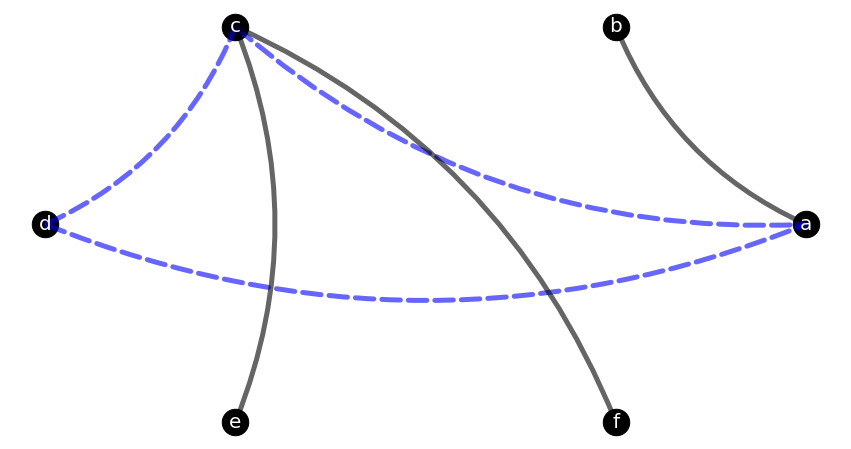
但是我希望连接线是曲线而不是直线。我在matplotlib中找不到可以实现这一点的线条样式。

1个回答

7

此答案类似,你可以这样做:

plt.figure(figsize=(15,8))

pos = nx.circular_layout(G)  # positions for all nodes

ax = plt.gca()

for edge in G.edges():
    source, target = edge
    rad = 0.2
    c = edge in elarge
    arrowprops=dict(arrowstyle="-", 
                    color='black' if c else 'blue',
                    connectionstyle=f"arc3,rad={rad}",
                    linestyle= '-' if c else '--',
                    alpha=0.6,
                    linewidth=5)
    ax.annotate("",
                xy=pos[source],
                xytext=pos[target],
                arrowprops=arrowprops
               )
# nodes
nx.draw_networkx_nodes(G, pos, node_size=700, node_color='black')
# labels
nx.draw_networkx_labels(G, pos, font_size=20, 
                        font_family="sans-serif", 
                        font_color ='white')

plt.box(False)
plt.show()

enter image description here


网页内容由stack overflow 提供, 点击上面的
可以查看英文原文,
原文链接