简短回答
在scikit-image中,对于这样的实现显然仍然是开放的[1],但在这个讨论串[2]中埋藏着一个链接,指向
theobdt提供的一些看起来非常不错的代码[3]。
from skimage import measure
from image_processing import boundary_tracing
labels = measure.label(image)
segments = measure.regionprops(labels)
coords = boundary_tracing(segments[0])[:, ::-1]
参考资料
[1] https://github.com/scikit-image/scikit-image/issues/1131
[2] https://github.com/scikit-image/scikit-image/issues/1131#issuecomment-657090334
[3] https://github.com/machine-shop/deepwings/blob/master/deepwings/method_features_extraction/image_processing.py#L156-L245
[4] https://scikit-image.org/docs/stable/auto_examples/segmentation/plot_label.html#sphx-glr-auto-examples-segmentation-plot-label-py
代码
从[3](
image_processing.py)中提取相关功能。
import numpy
def moore_neighborhood(current, backtrack):
"""Returns clockwise list of pixels from the moore neighborhood of current\
pixel:
The first element is the coordinates of the backtrack pixel.
The following elements are the coordinates of the neighboring pixels in
clockwise order.
Parameters
----------
current ([y, x]): Coordinates of the current pixel
backtrack ([y, x]): Coordinates of the backtrack pixel
Returns
-------
List of coordinates of the moore neighborood pixels, or 0 if the backtrack
pixel is not a current pixel neighbor
"""
operations = np.array([[-1, 0], [-1, 1], [0, 1], [1, 1], [1, 0], [1, -1],
[0, -1], [-1, -1]])
neighbors = (current + operations).astype(int)
for i, point in enumerate(neighbors):
if np.all(point == backtrack):
return np.concatenate((neighbors[i:], neighbors[:i]))
return 0
def boundary_tracing(region):
"""Coordinates of the region's boundary. The region must not have isolated
points.
Parameters
----------
region : obj
Obtained with skimage.measure.regionprops()
Returns
-------
boundary : 2D array
List of coordinates of pixels in the boundary
The first element is the most upper left pixel of the region.
The following coordinates are in clockwise order.
"""
coords = region.coords
maxs = np.amax(coords, axis=0)
binary = np.zeros((maxs[0] + 2, maxs[1] + 2))
x = coords[:, 1]
y = coords[:, 0]
binary[tuple([y, x])] = 1
idx_start = 0
while True:
start = [y[idx_start], x[idx_start]]
focus_start = binary[start[0]-1:start[0]+2, start[1]-1:start[1]+2]
if np.sum(focus_start) > 1:
break
idx_start += 1
if (binary[start[0] + 1, start[1]] == 0 and
binary[start[0]+1, start[1]-1] == 0):
backtrack_start = [start[0]+1, start[1]]
else:
backtrack_start = [start[0], start[1] - 1]
current = start
backtrack = backtrack_start
boundary = []
counter = 0
while True:
neighbors_current = moore_neighborhood(current, backtrack)
y = neighbors_current[:, 0]
x = neighbors_current[:, 1]
idx = np.argmax(binary[tuple([y, x])])
boundary.append(current)
backtrack = neighbors_current[idx-1]
current = neighbors_current[idx]
counter += 1
if (np.all(current == start) and np.all(backtrack == backtrack_start)):
break
return np.array(boundary)
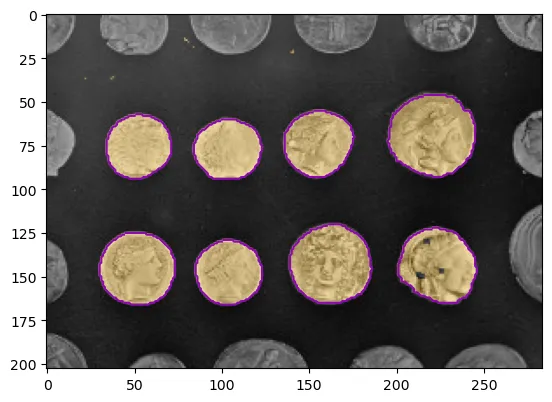
最简工作示例
基于[4]
import numpy as np
from skimage import (
    data,
    color,
    filters,
    measure,
    morphology,
    segmentation
)
import matplotlib.pyplot as plt
from image_tracing import boundary_tracing
image = data.coins()[50:-50, 50:-50]
thresh = filters.threshold_otsu(image)
bw = morphology.closing(image > thresh, morphology.square(3))
cleared = segmentation.clear_border(bw)
label_image = measure.label(cleared)
image_label_overlay = color.label2rgb(
label_image,
image=image,
colors=[(1.0, 0.7, 0.0)],
bg_label=0,
)
segments = sorted(
measure.regionprops(label_image),
key=lambda x: x.area,
reverse=True
)[:8]
fig, ax = plt.subplots()
ax.imshow(image_label_overlay)
for segment in segments:
coords = boundary_tracing(segment)
ax.plot(coords[:, 1], coords[:, 0], color="#8C09B3")