我建议使用
df.plot.box,并将
patch_artist=True和
return_type='both'一起使用(这将返回绘制箱形图的matplotlib轴和字典,其值是箱形图的matplotlib线),以获得最佳的自定义可能性。
例如,给定以下数据:
import numpy as np
import pandas as pd
import matplotlib.pyplot as plt

df = pd.DataFrame(
    data=np.random.randn(100, 4),
    columns=list("ABCD")
)
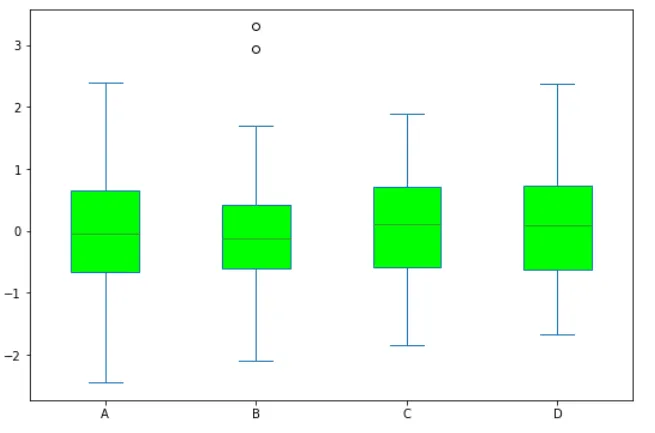
您可以为
所有的框设置特定的颜色:
fig,ax = plt.subplots(figsize=(9,6))
ax,props = df.plot.box(patch_artist=True, return_type='both', ax=ax)
for patch in props['boxes']:
    patch.set_facecolor('lime')
plt.show()
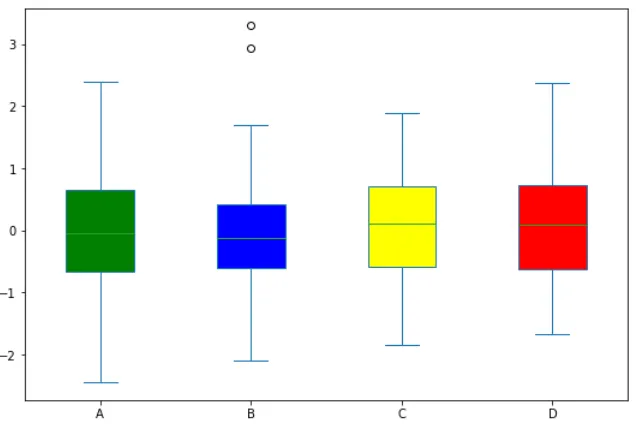
你可以为每个方框设置特定的颜色:
colors = ['green','blue','yellow','red']

fig,ax = plt.subplots(figsize=(9,6))
ax,props = df.plot.box(patch_artist=True, return_type='both', ax=ax)
for patch,color in zip(props['boxes'],colors):
    patch.set_facecolor(color)
plt.show()
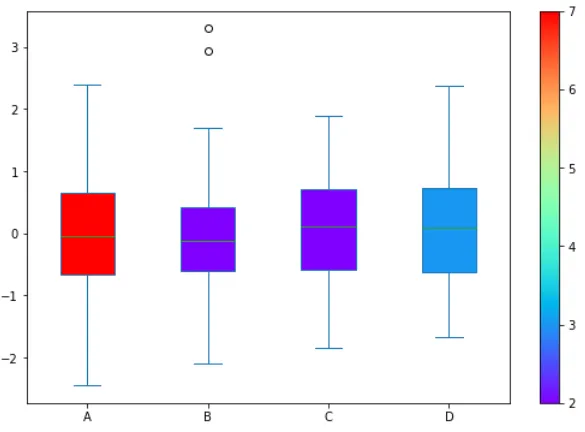
您可以轻松地集成一个颜色映射:
colors = np.random.randint(0,10, 4)
cm = plt.cm.get_cmap('rainbow')
colors_cm = [cm((c-colors.min())/(colors.max()-colors.min())) for c in colors]
fig,ax = plt.subplots(figsize=(9,6))
ax,props = df.plot.box(patch_artist=True, return_type='both', ax=ax)
for patch,color in zip(props['boxes'],colors_cm):
patch.set_facecolor(color)
fig.colorbar(plt.cm.ScalarMappable(
plt.cm.colors.Normalize(min(colors),max(colors)),
cmap='rainbow'
), ax=ax, cmap='rainbow')
plt.show()