我认为这是因为右侧y轴标签的外观由
theme()中的
axis.text.y.right决定,虽然它继承自
axis.text.y,但
它仅继承未在axis.text.y.right本身中声明的参数。
根据
?theme中的详细信息,
axis.text.y.right的继承链如下:
axis.text.y.right ->
axis.text.y ->
axis.text ->
text
ggplot中的默认主题是
theme_grey。在控制台中输入
theme_grey(末尾不带
()),您将看到完整的函数。让我们看看相关部分:
function(base_size = 11, base_family = "", base_line_size = base_size/22,
         base_rect_size = base_size/22) {

  half_line <- base_size/2

  theme(text = element_text(family = base_family,
                            face = "plain",
                            colour = "black",
                            size = base_size,
                            lineheight = 0.9,
                            hjust = 0.5,
                            vjust = 0.5,
                            angle = 0,
                            margin = margin(),
                            debug = FALSE),

        axis.text = element_text(size = rel(0.8),
                                 colour = "grey30"),

        axis.text.y = element_text(margin = margin(r = 0.8 * half_line/2),
                                   hjust = 1),

        axis.text.y.right = element_text(margin = margin(l = 0.8 * half_line/2),
                                         hjust = 0),
        ...
        complete = TRUE)
}
?element_text 显示了 element_text 函数所期望的完整参数列表:
element_text(family = NULL, face = NULL, colour = NULL, size = NULL,
  hjust = NULL, vjust = NULL, angle = NULL, lineheight = NULL,
  color = NULL, margin = NULL, debug = NULL, inherit.blank = FALSE)
考虑到所有的继承关系,
theme_grey主题中
axis.text.y.right实际上的参数如下:
- family =
base_family(从text继承)
- face =
"plain"(从text继承)
- colour =
"grey30"(从axis.text继承,用以覆盖text中的"black")
- size =
base_size的80%(来自于axis.text对text的base_size进行rel(0.8)修改)
- hjust =
0(从axis.text.y.right继承,用以覆盖axis.text.y的1,text的0.5)
- vjust =
0.5(从text继承)
- angle =
0(从text继承)
- lineheight =
0.9(从text继承)
- margin =
margin(l = 0.8 * half_line/2)(从axis.text.y.right继承,用以覆盖axis.text.y的margin = margin(r = 0.8 * half_line/2,以及text中的margin())
- debug =
FALSE(从text继承)
- inherit.blank =
FALSE(来自于element_text的默认参数)
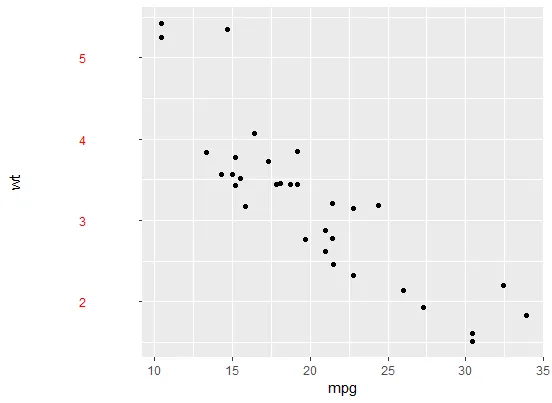
因此,对于下面的代码片段,
axis.text.y.right将会继承
color = "red"(覆盖了
axis.text中的
colour = "grey30")。但由于它有自己的边距参数,将不会继承
margin = margin(40, 40, 40, 40):
ggplot(mtcars, aes(mpg, wt)) +
    geom_point() +
    scale_y_continuous(position = "right") +
    theme(axis.text.y = element_text(color = "red", margin = margin(40, 40, 40, 40)))
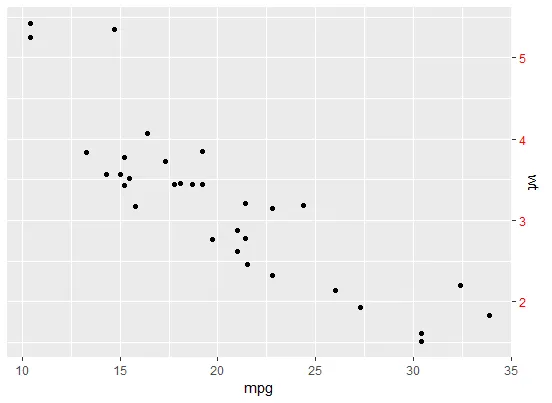
指定
axis.text.y.right而不是
axis.text.y即可解决问题:
ggplot(mtcars, aes(mpg, wt)) +
  geom_point() +
  scale_y_continuous(position = "right") +
  theme(axis.text.y.right = element_text(color = "red", margin = margin(40, 40, 40, 40)))