调整ggplot2中轴标签的“边距”空间

7

ggplot中哪个属性控制轴文本的宽度(或空白空间)?


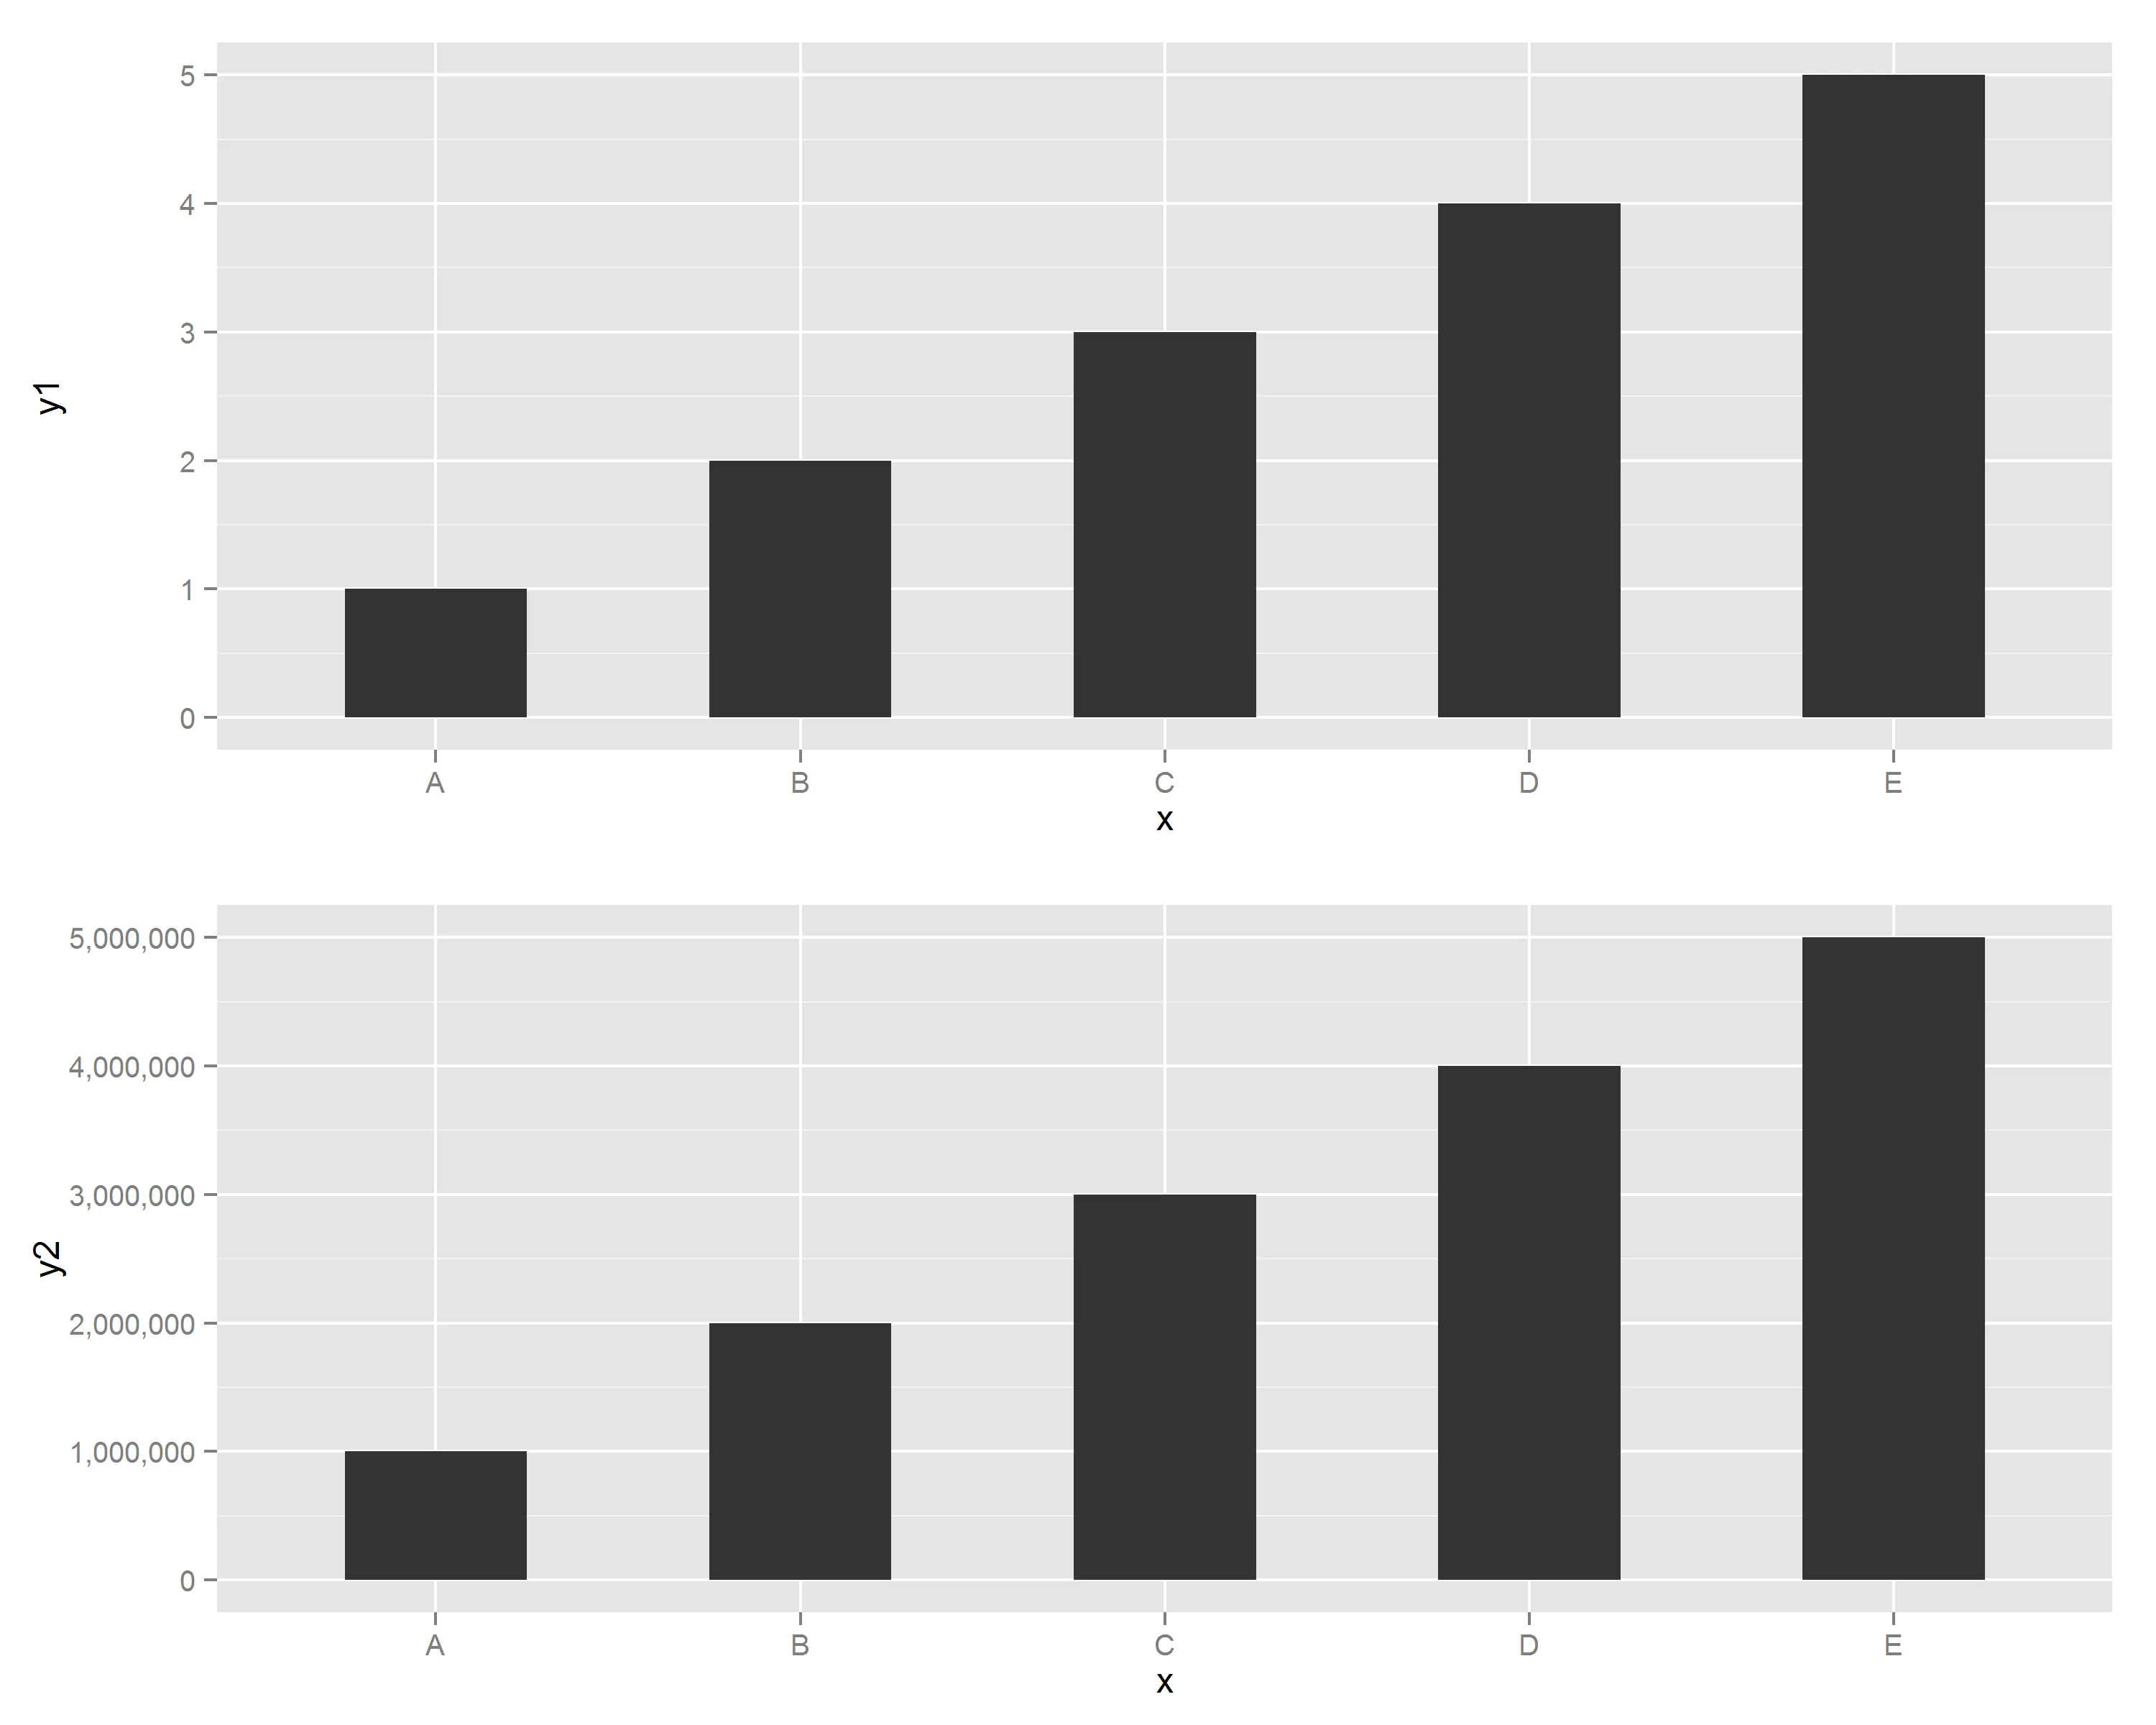
在下面的示例中,我的最终目标是“推入”顶部图表的左侧,以使其与底部图表对齐。

我尝试了theme(plot.margin=..),但那会影响整个图表的边距。
facet也无济于事,因为y轴上的比例不同。

作为最后的手段,我意识到我可以修改轴文本本身,但那时我还需要计算每个图表的切割。
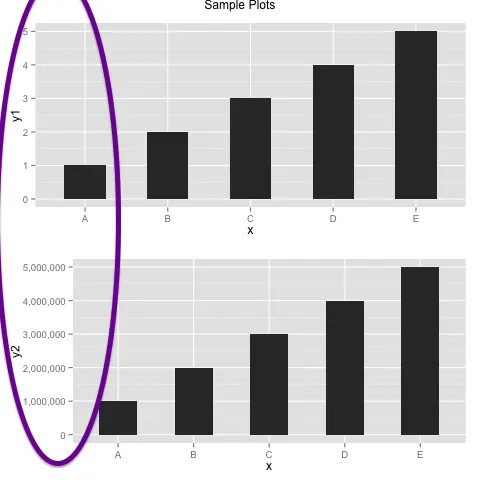
enter image description here

可重现的示例:

library(ggplot2)
library(scales)

D <- data.frame(x=LETTERS[1:5],  y1=1:5, y2=1:5 * 10^6)

P.base <- ggplot(data=D, aes(x=x)) + 
            scale_y_continuous(labels=comma)

Plots <- list(
    short = P.base + geom_bar(aes(y=y1), stat="identity", width=.5)
  , long  = P.base + geom_bar(aes(y=y2), stat="identity", width=.5) 
  )

do.call(grid.arrange, c(Plots, ncol=1, main="Sample Plots"))

1
grid.arrange 在对齐图形方面表现不佳,你应该总是使用 gtable。 - baptiste
1
谢谢@baptiste,这似乎正是我在寻找的。请随意发布您自己的答案。另外,我很好奇为什么rbind_gtable不是一个导出函数? - Ricardo Saporta
1
rbind.gtable被导出为一个方法,但它使用Reduce函数将多个gtables进行合并。要么如此,或者Hadley对下划线有特别的喜好。 - baptiste
1个回答

9

这里有一个解决方案。

这个想法来源于 "在 2x1 面板上水平而不是垂直标签并分割 y 标签"。定义一个函数。

align_plots1 <- function (...) {
    pl <- list(...)
    stopifnot(do.call(all, lapply(pl, inherits, "gg")))
    gl <- lapply(pl, ggplotGrob)
    bind2 <- function(x, y) gtable:::rbind_gtable(x, y, "first")
    combined <- Reduce(bind2, gl[-1], gl[[1]])
    wl <- lapply(gl, "[[", "widths")
    combined$widths <- do.call(grid::unit.pmax, wl)
    grid::grid.newpage()
    grid::grid.draw(combined)
}

short <- P.base + geom_bar(aes(y=y1), stat="identity", width=.5)
long <- P.base + geom_bar(aes(y=y2), stat="identity", width=.5) 

#Now, align the plots
align_plots1(short, long)

这是输出结果。 enter image description here

2
当你从其他地方借用解决方案时,将原始问题链接到你的代码中是有用的,并且是良好的礼仪。 - baptiste
谢谢提醒。我忘了附上我找到那个解决方案的链接。我已经添加了链接。 - Jd Baba

网页内容由stack overflow 提供, 点击上面的
可以查看英文原文,
原文链接