简短版本: 如何获取轴标签和轴标题之间的边距值?
详细版本: 我正在尝试合并三个ggplot图形。比例尺应该保持一致,因此我使用rbind(与ggplotGrob一起)来对齐前两个图形。但是最后一个图形具有多面性,因此不可能对所有三个图形使用此解决方案。
我的想法是在第三个图形中手动设置轴标题和轴标签之间的间距(可以使用element_text中的margin进行设置)。 但是,为了做到这一点,我应该在前两个图形中获取此边距的值。我相信这些信息在ggplotGrob中是可用的,但我不知道在grob结构中检索此值的路径。
虚拟代码示例:
library(ggplot2)
library(gridExtra)
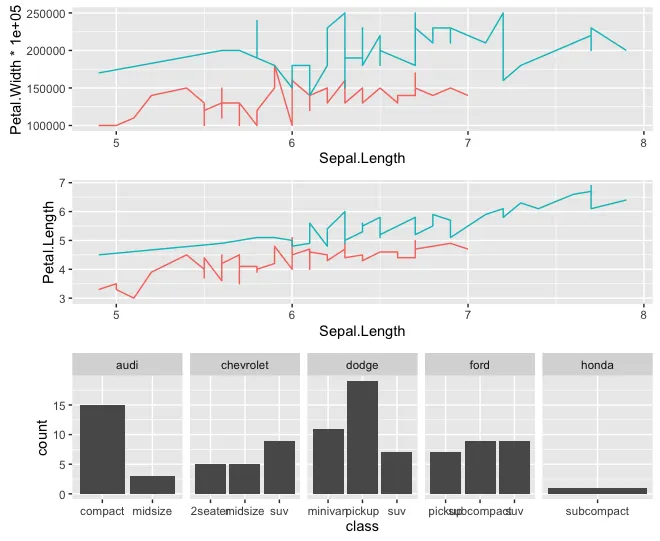
a <- ggplotGrob( ggplot(iris[iris$Species != "setosa",], aes(x=Sepal.Length, y=Petal.Width*100000, color=Species)) + geom_line() + theme(legend.position="none"))
b <- ggplotGrob( ggplot(iris[iris$Species != "setosa",], aes(x=Sepal.Length, y=Petal.Length, color=Species)) + geom_line() + theme(legend.position="none"))
c <- ggplotGrob(ggplot(head(mpg, 100), aes(class)) + geom_bar() + facet_grid(.~manufacturer, scales="free_x"))
g1 <- rbind(a, b, size="first")
grid.arrange(g1, c, ncol=1)
当前结果:前两个图形的绘图区域对齐,但最后一个图形没有对齐。 结果图
期望结果:所有三幅图形的绘图区域都应该对齐。