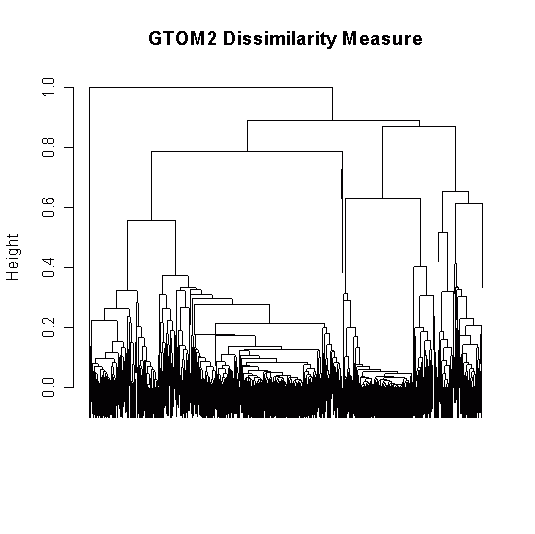
我的树状图非常丑陋,几乎难以阅读,通常看起来像这样:
library(TraMineR)
library(cluster)
data(biofam)
lab <- c("P","L","M","LM","C","LC","LMC","D")
biofam.seq <- seqdef(biofam[1:500,10:25], states=lab)

ccost <- seqsubm(biofam.seq, method = "CONSTANT", cval = 2, with.missing=TRUE)
sequences.OM <- seqdist(biofam.seq, method = "OM", norm= TRUE, sm = ccost,
with.missing=TRUE)

clusterward <- agnes(sequences.OM, diss = TRUE, method = "ward")
plot(clusterward, which.plots = 2)
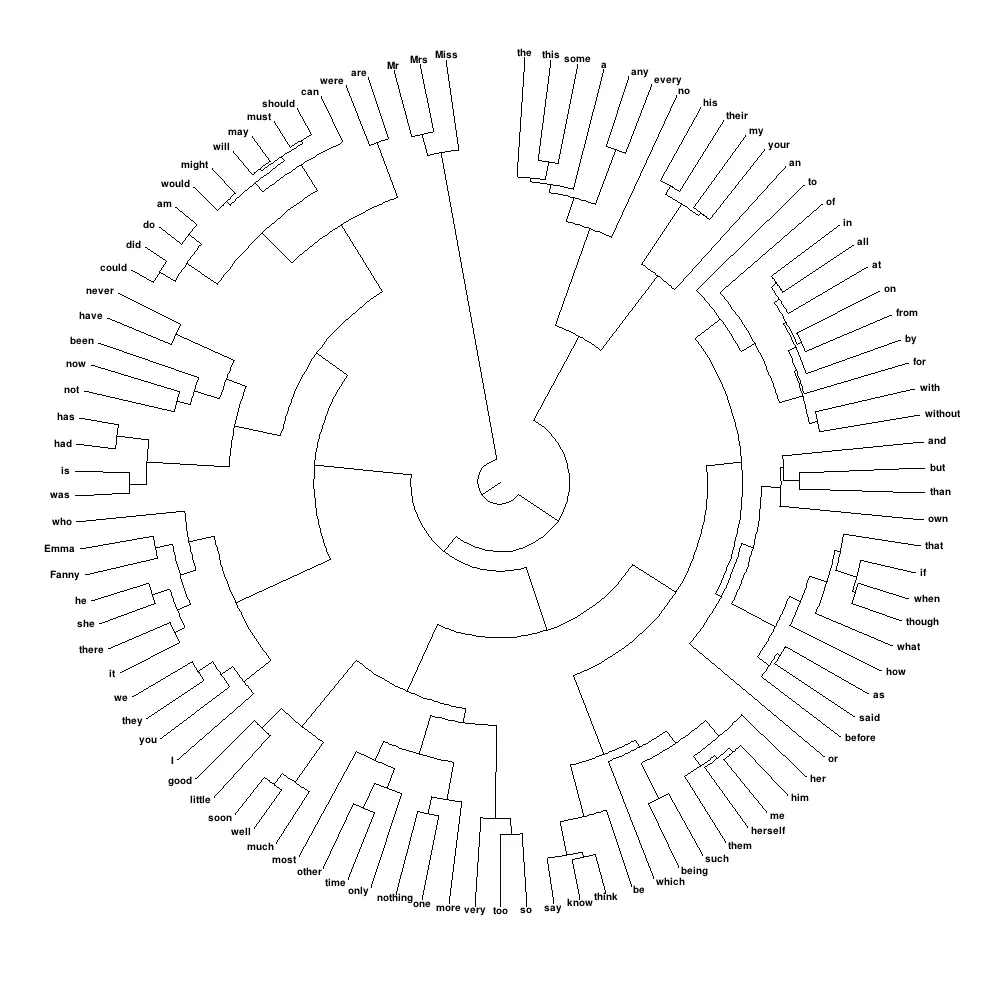
我想要创建的东西类似于以下内容,即一个圆形树状图,在其中可以仔细控制标签的大小,以便它们实际上可见:
 我该如何在R中实现这个功能?