我正在尝试找到最适合给定数据的模型。我的做法是通过循环各种n值,并利用公式((y_fit - y_actual) / y_actual) x 100计算每个p处的残差。然后对于每个n,计算这个残差的平均值,找到最小残差均值和相应的n值,并使用该值进行拟合。以下是可重现的代码:
import numpy as np
import matplotlib.pyplot as plt
from scipy import optimize
x = np.array([12.4, 18.2, 20.3, 22.9, 27.7, 35.5, 53.9])
y = np.array([1, 50, 60, 70, 80, 90, 100])
y_residual = np.empty(shape=(1, len(y)))
residual_mean = []
n = np.arange(0.01, 10, 0.01)
def fit(x, a, b):
return a * x + b
for i in range (len(n)):
x_fit = 1 / np.log(x) ** n[i]
y_fit = y
fit_a, fit_b = optimize.curve_fit(fit, x_fit, y_fit)[0]
y_fit = (fit_a * x_fit) + fit_b
y_residual = (abs(y_fit - y) / y) * 100
residual_mean = np.append(residual_mean, np.mean(y_residual[np.isfinite(y_residual)]))
p = n[np.where(residual_mean == residual_mean.min())]
p = p[0]
print p
x_fit = 1 / np.log(x) ** p
y_fit = y
fit_a, fit_b = optimize.curve_fit(fit, x_fit, y_fit)[0]
y_fit = (fit_a * x_fit) + fit_b
y_residual = (abs(y_fit - y) / y) * 100
fig = plt.figure(1, figsize=(5, 5))
fig.clf()
plot = plt.subplot(111)
plot.plot(x, y, linestyle = '', marker='^')
plot.plot(x, y_fit, linestyle = ':')
plot.set_ylabel('y')
plot.set_xlabel('x')
plt.show()
fig_1 = plt.figure(2, figsize=(5, 5))
fig_1.clf()
plot_1 = plt.subplot(111)
plot_1.plot(1 / np.log(x) ** p, y, linestyle = '-')
plot_1.set_xlabel('pow(x, -p)' )
plot_1.set_ylabel('y' )
plt.show()
fig_2 = plt.figure(2, figsize=(5, 5))
fig_2.clf()
plot_2 = plt.subplot(111)
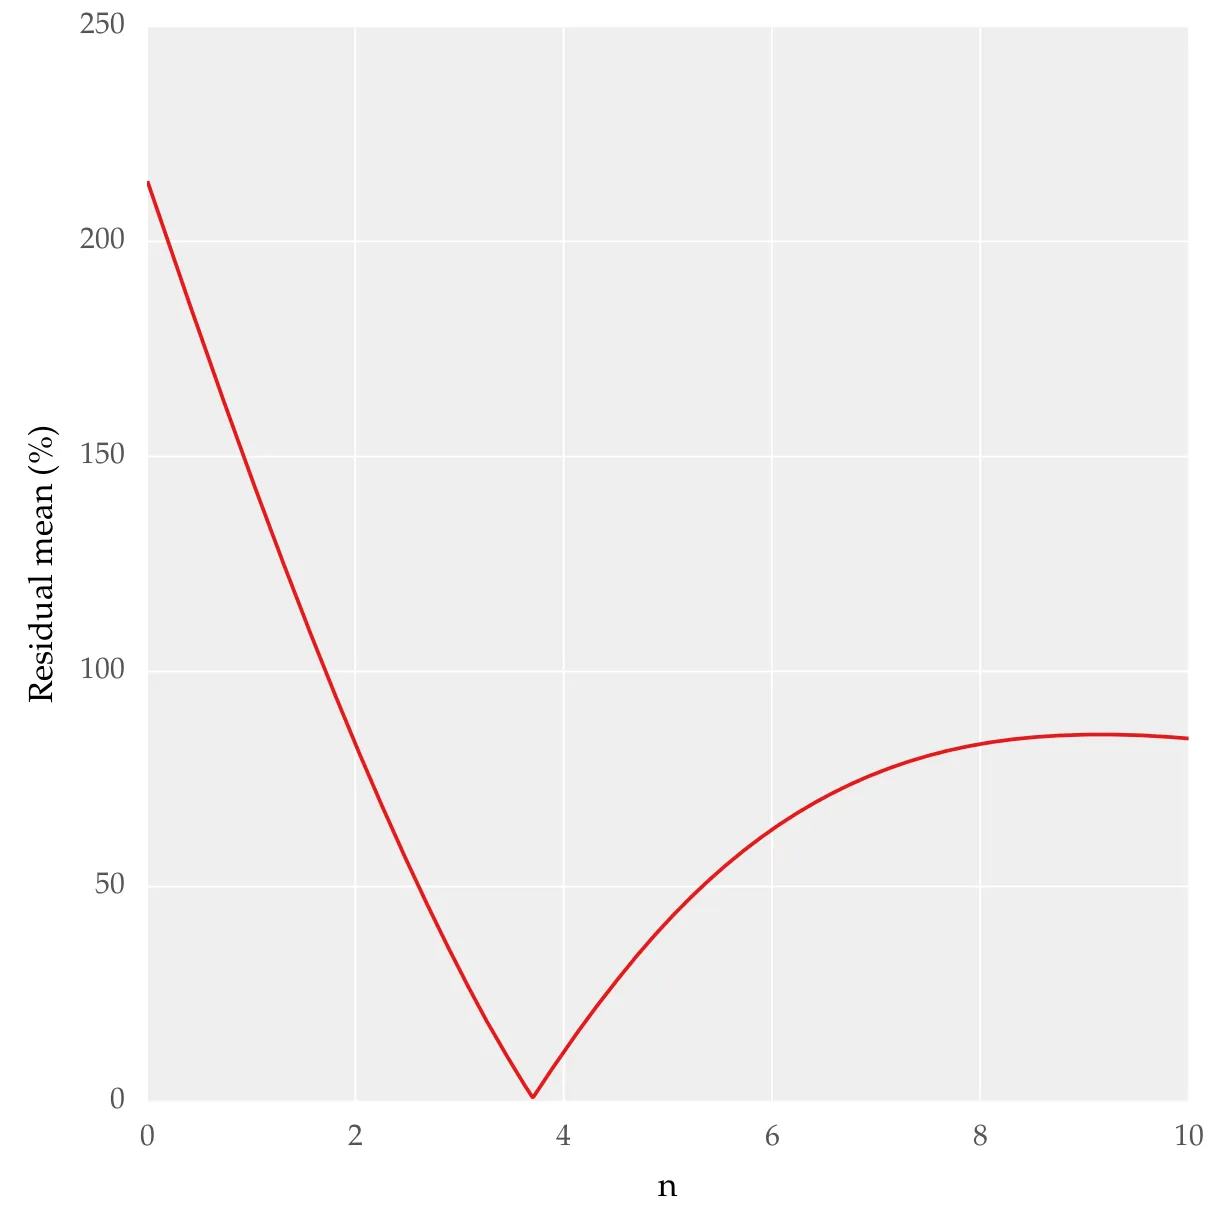
plot_2.plot(n, residual_mean, linestyle = '-')
plot_2.set_xlabel('n' )
plot_2.set_ylabel('Residual mean')
plt.show()
通过 n 绘制残差均值,我得到了以下结果:
我需要知道这种方法是否正确用于确定最佳拟合,并且是否可以使用 SciPy 或其他包中的其他函数实现。本质上,我想要定量地知道哪种拟合最好。我已经看过 SciPy 中适合度检验 但并没有对我很有帮助。