我正在尝试绘制双底部x轴,根据跳跃后的图像:
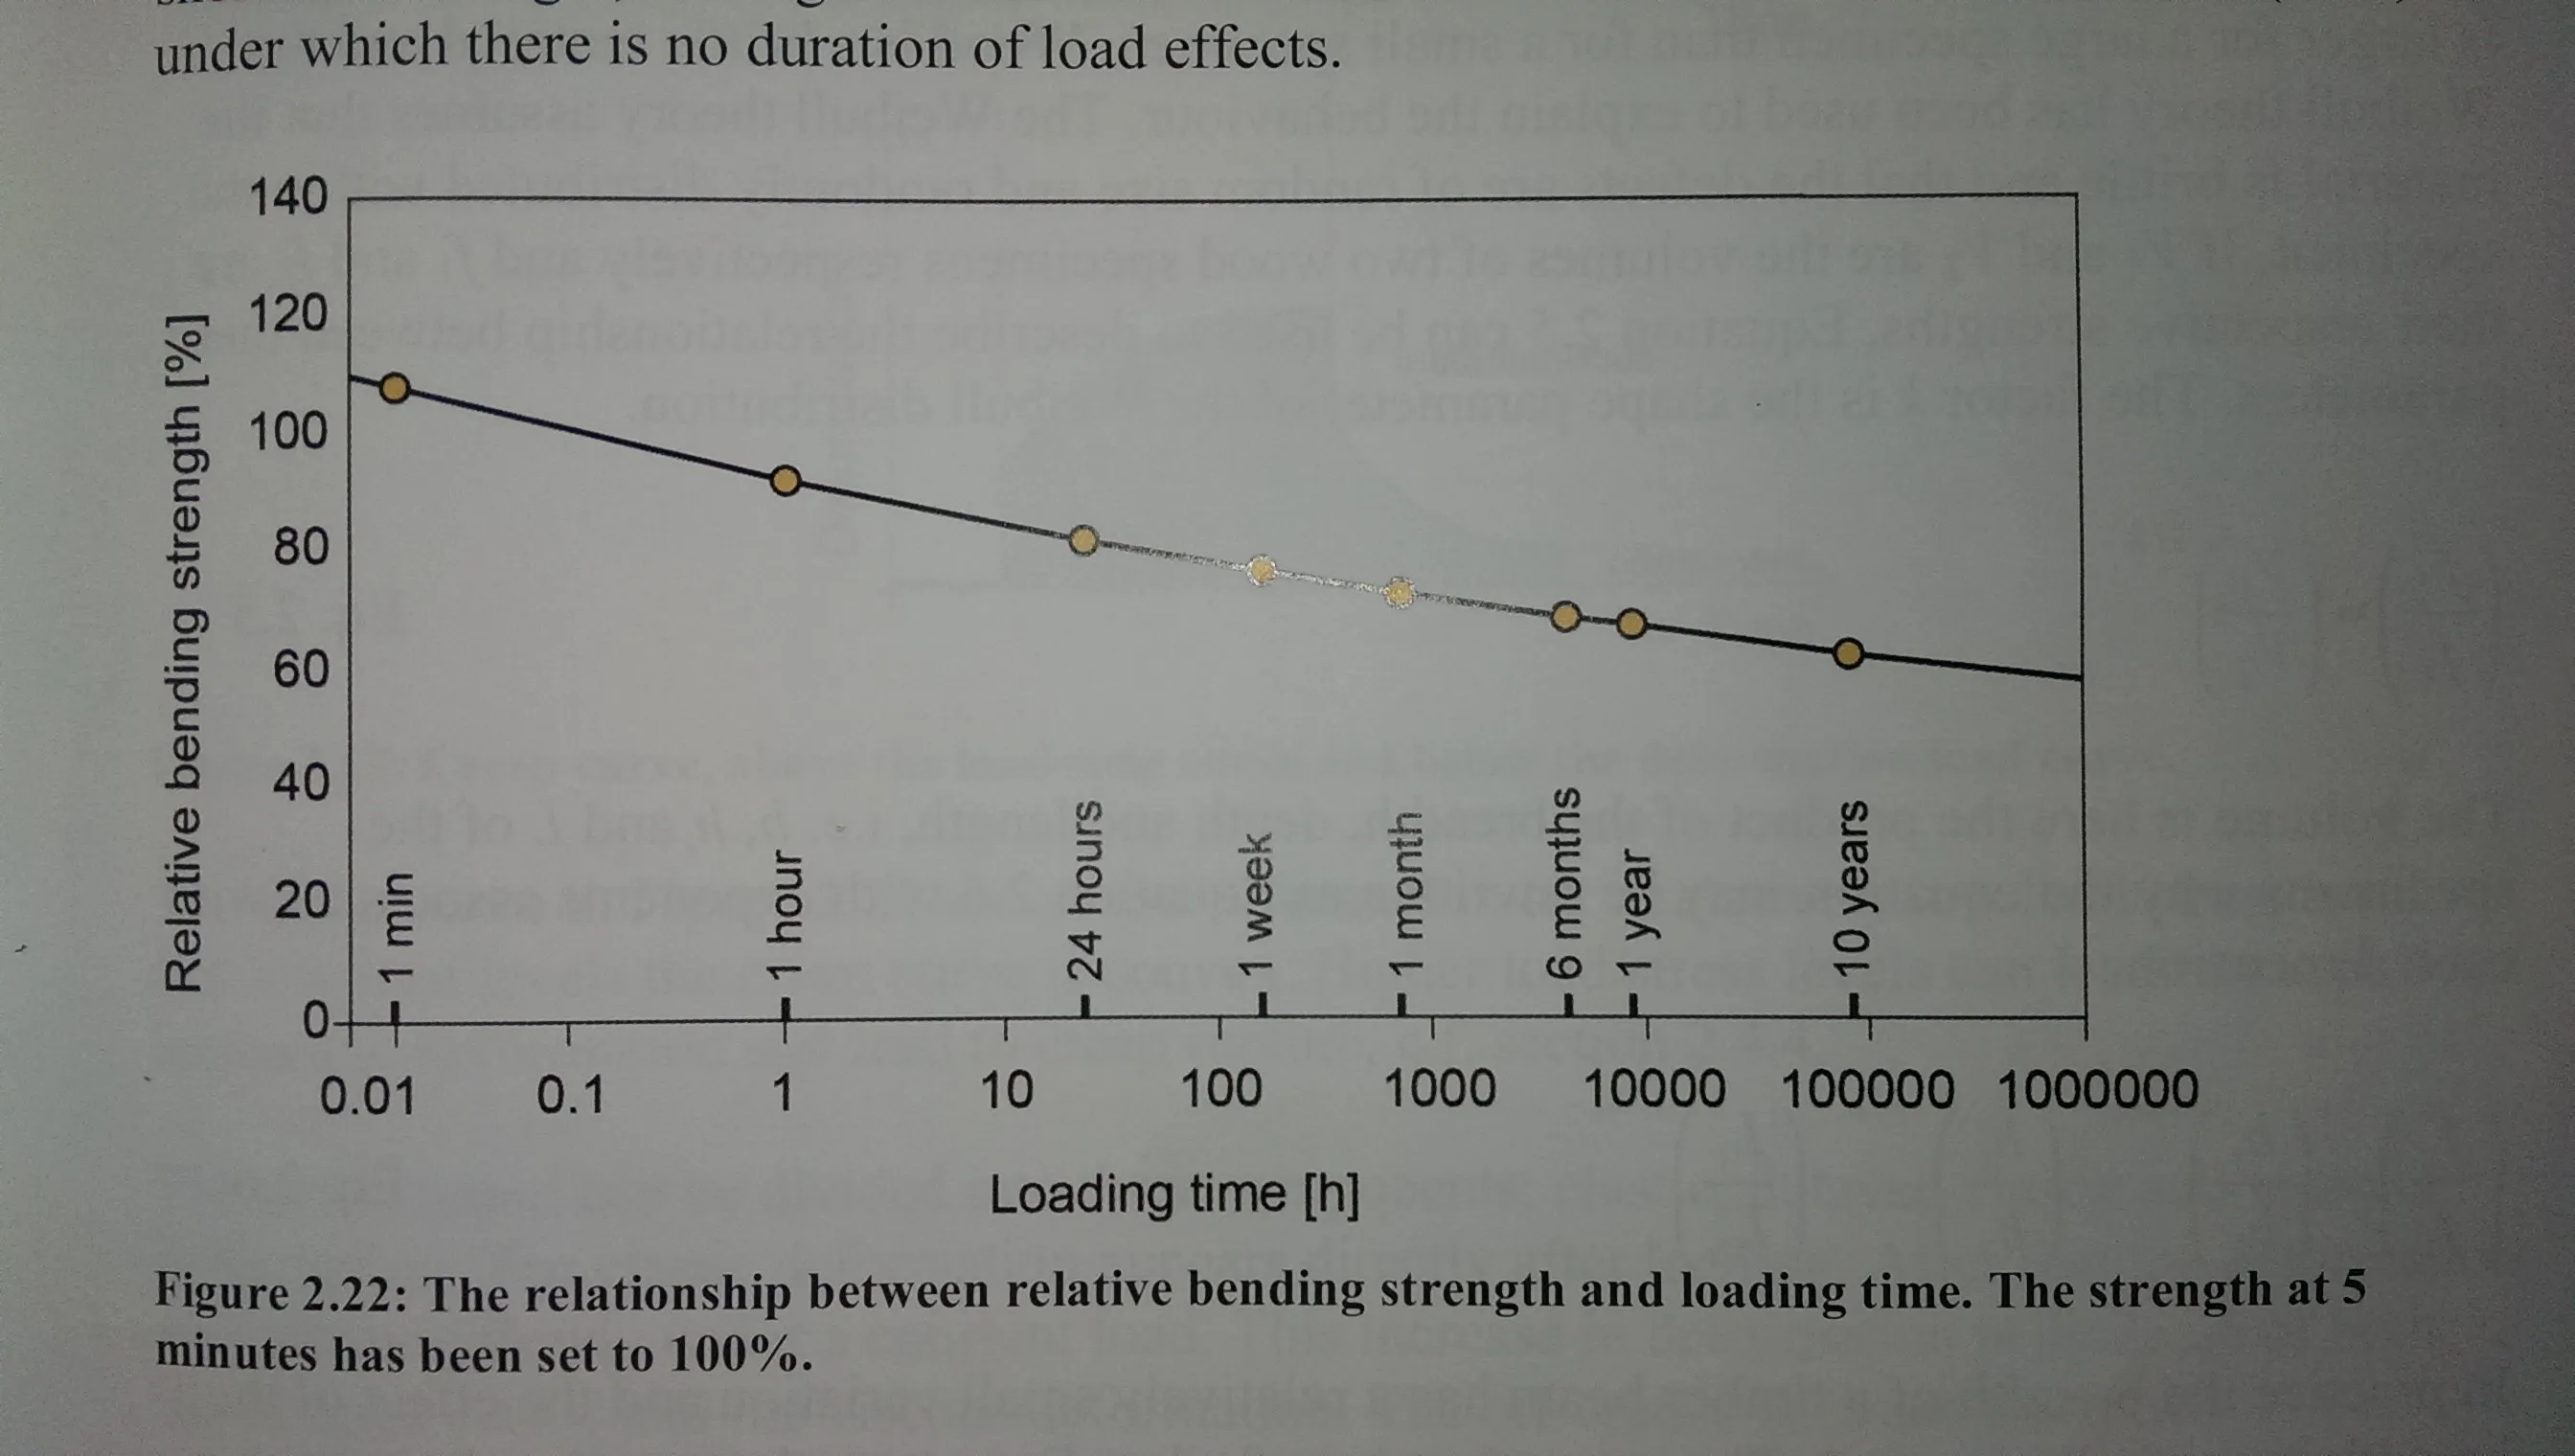
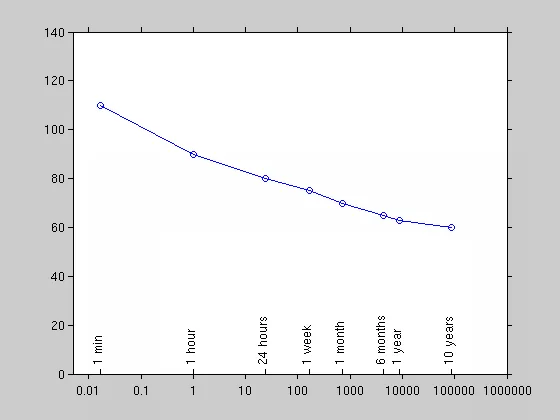
这是一个以小时为单位的semilogx-plot,具有表示分钟、月份和年份的其他特定刻度。如何创建这些额外的刻度?
我正在尝试绘制双底部x轴,根据跳跃后的图像:
这是一个以小时为单位的semilogx-plot,具有表示分钟、月份和年份的其他特定刻度。如何创建这些额外的刻度?
clear, close
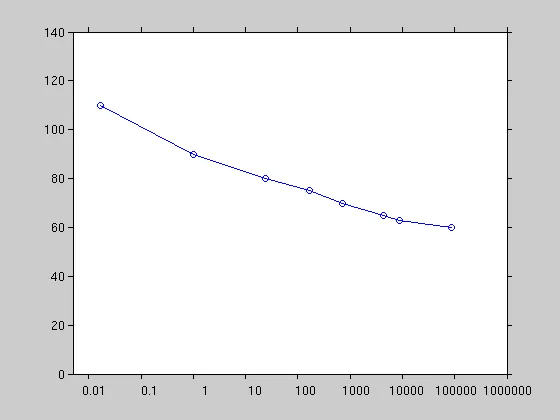
time = [1/60, 1, 24, 24*7, 24*30, 24*30*6, 24*365, 24*365*10];
r = [110, 90, 80, 75, 70, 65, 63, 60];
% plot the data
semilogx(time, r, 'o-')
% adjust ticks and format of primary axes
xlim([0.005 1e6])
ylim([0 140])
tick = 10 .^ (-2 : 6);
set(gca, 'XTick', tick)
set(gca, 'XTickLabel', arrayfun(@num2str, tick, 'UniformOutput', false))
set(gca, 'XMinorTick', 'off')
set(gca, 'TickDir', 'out')
仅当次要轴与主轴具有相同的位置、大小、轴限制和比例类型,并且其背景是透明的(否则数据将被隐藏),覆盖第二个轴才能正常工作:
% put matching secondary axes on top with transparent background
pos = get(gca, 'Position');
axes('Position', pos)
set(gca, 'Color', 'none')
xlim([0.005 1e6])
ylim([0 140])
set(gca, 'XScale', 'log')
set(gca, 'XMinorTick', 'off')
set(gca, 'TickDir', 'out')
% adjust ticks
set(gca, 'YTick', [])
set(gca, 'XTick', time)
label = {'1 min', '1 hour', '24 hours', '1 week', '1 month', '6 months', '1 year', '10 years'};
set(gca, 'XTickLabel', label)
结果是
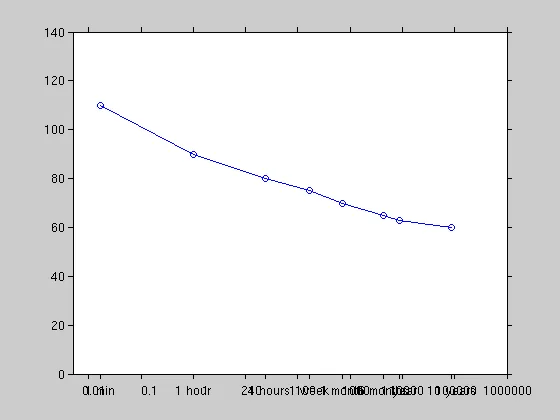
这并不是我们想要的。
通过一个技巧,我们可以让次坐标轴的刻度和刻度标签进入内部...
% tinker with it
set(gca, 'XAxisLocation', 'top')
pos(4) = eps * pos(4);
set(gca, 'Position', pos)
...但这还不是我们想要的。
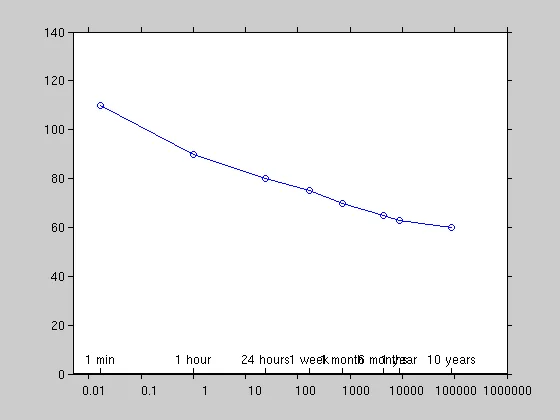
另一种策略:我们不要重叠坐标轴,而是自己添加额外的刻度!
label = {'1 min', '1 hour', '24 hours', '1 week', '1 month', '6 months', '1 year', '10 years'};
line([time', time'], [0 2], 'Color', 'k')
text(time, 4 * ones(size(time)), label, 'Rotation', 90, 'VerticalAlignment', 'middle')
结果
仍然不是完美的,但可用。
close all
plot(1:10, 1:10)
set(gca,'XTick',[1:2:10])
haxes1 = gca;
set(haxes1, 'TickDir', 'out')
haxes1_pos = get(haxes1,'Position'); % store position of first axes
haxes2 = axes('Position',haxes1_pos);
set(gca, 'Color', 'none')
set(haxes2, 'YTick', [])
set(haxes2, 'XTickMode', 'manual');
set(haxes2, 'XTick', [ 0.1 0.8])
set(haxes2, 'TickDir', 'in')