我正在使用 plot() 函数绘制图表,但默认情况下它不显示坐标轴。
如何在图表上启用显示 x=0 和 y=0 的坐标轴?
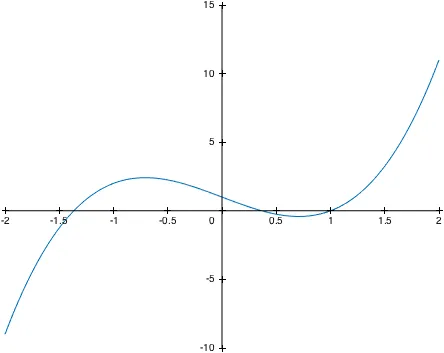
事实上,我的图表类似于:
我想要一条对应于 y=0 的水平线。 我该怎么做?
我正在使用 plot() 函数绘制图表,但默认情况下它不显示坐标轴。
如何在图表上启用显示 x=0 和 y=0 的坐标轴?
事实上,我的图表类似于:
我想要一条对应于 y=0 的水平线。 我该怎么做?
这应该在Matlab中运行:
set(gca, 'XAxisLocation', 'origin')
选项包括:bottom(底部)、top(顶部)、origin(原点)。
对于Y轴:
YAxisLocation; left, right, origin
默认情况下,绘图会显示坐标轴,除非您修改了一些设置。尝试以下操作:
hold on; % make sure no new plot window is created on every plot command
axes(); % produce plot window with axes
plot(% whatever your plot command is);
plot([0 10], [0 0], 'k-'); % plot the horizontal line
hold on; 命令会初始化一个坐标轴,然后 axes(); 命令会在第一个坐标轴上创建一个新的坐标轴,第二个坐标轴成为当前坐标轴并且无法 "hold on" 。简单的 plot(...); hold on; plot(...); 命令顺序应该能够解决问题。 - gnovicehold on;plot([0 0],ylim,'k');hold on;plot(xlim,[0 0],'k'); 然而我的代码没有绘制坐标轴刻度线... - Trevor Boyd Smith我知道这有点晚了,但我的同事找到了一些解决方法:
figure, plot ((1:10),cos(rand(1,10))-0.75,'*-')
hold on
plot ((1:10),zeros(1,10),'k+-')
text([1:10]-0.09,ones(1,10).*-0.015,[{'0' '1'  '2' '3' '4' '5' '6' '7' '8' '9'}])
set(gca,'XTick',[], 'XColor',[1 1 1])
box off
grid on即可。@Martijn,你的函数调用顺序略有偏差。请尝试使用以下方式:
x=-3:0.1:3;
y = x.^3;
plot(x,y), hold on
plot([-3 3], [0 0], 'k:')
hold off
axes();调用上(请参见我上面的评论)。如果你有hold on; plot(x,y); plot(...);,它仍然会正确地工作。 - gnovicex = linspace(-2,2,101);
plot(x,2*x.^3-3*x+1);
axes0