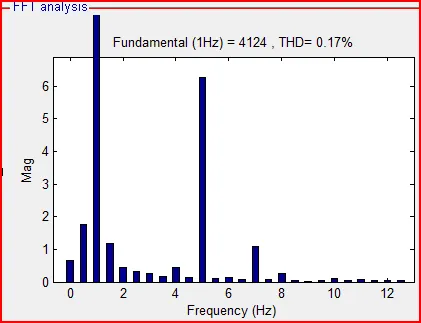
如何使用MATLAB在轴外绘制图形?我想要绘制类似于以下图片的内容:
 谢谢。
谢谢。
谢谢。以下是使用两个轴的一种可能的技巧:
%# plot data as usual
x = randn(1000,1);
[count bin] = hist(x,50);
figure, bar(bin,count,'hist')
hAx1 = gca;

%# create a second axis as copy of first (without its content),
%# reduce its size, and set limits accordingly
hAx2 = copyobj(hAx1,gcf);
set(hAx2, 'Position',get(hAx1,'Position').*[1 1 1 0.9], ...
    'XLimMode','manual', 'YLimMode','manual', ...
    'YLim',get(hAx1,'YLim').*[1 0.9])
delete(get(hAx2,'Children'))

%# hide first axis, and adjust Z-order
axis(hAx1,'off')
uistack(hAx1,'top')

%# add title and labels
title(hAx2,'Title')
xlabel(hAx2, 'Frequency'), ylabel(hAx2, 'Mag')
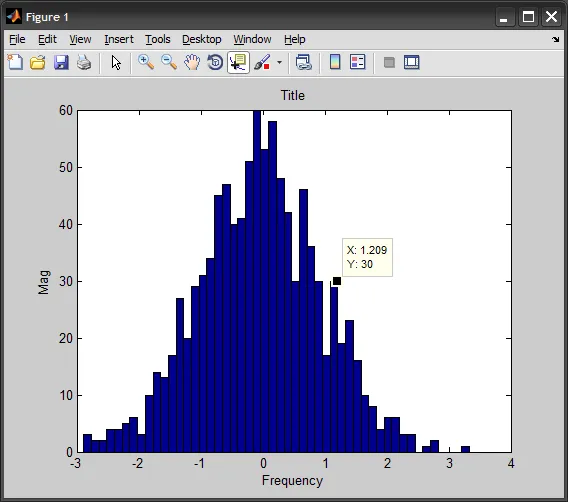
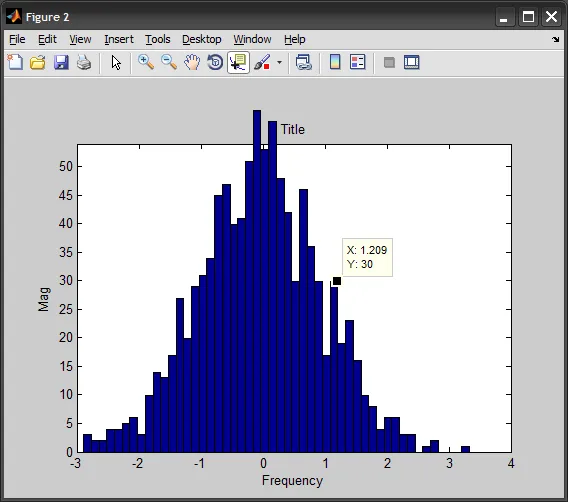
这是修改前后的界面对比图:
YLim而不是YTick..现在已经修复 :) - Amro您可以显示一个带有所需比例的轴,然后在另一个轴上绘制数据,该轴是不可见的且足够大以容纳所需数据:
f = figure;

% some fake data
x = 0:20;
y = 23-x;
a_max = 20;
b_max = 23;
a_height = .7;

%% axes you'll see
a = axes('Position', [.1 .1 .8 a_height]);
xlim([0 20]);
ylim([0 20]);

%% axes you'll use
scale = b_max/a_max;
a2 = axes('Position', [.1 .1 .8 scale*a_height]);
p = plot(x, y);
xlim([0 20]);
ylim([0 b_max]);
set(a2, 'Color', 'none', 'Visible', 'off');
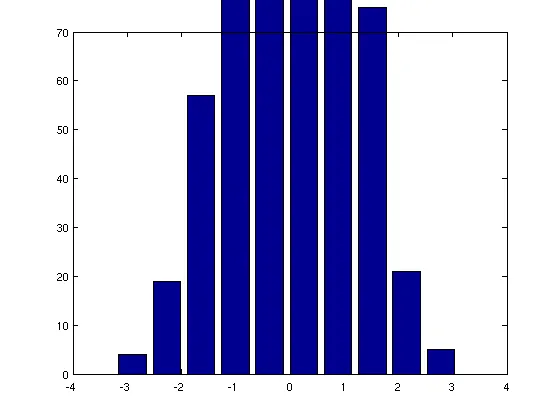
我曾经遇到了类似的问题,幸运的是通过这个答案我解决了它。对于柱状图系列,代码如下:
[a,b] = hist(randn(1000,1)); % generate random data and histogram
h = bar(b,a); % plot bar series
ylim([0 70]) % set limits
set(get(h,'children'),'clipping','off')% turn off clippings
barseries的clipping设置为off可以解决问题,但是这对我似乎不起作用。 - Jonas