我有以下关于R中Flexdashboard的示例代码:
---
title: "My Dashboard"
runtime: shiny
output:
  flexdashboard::flex_dashboard:
    orientation: rows
    vertical_layout: fill
always_allow_html: yes
---

```{r init, include=FALSE, echo=FALSE}
gc()

```


```{r setup1, include = FALSE}
library(flexdashboard)
library(thematic)
library(ggplot2)
library(bslib)
library(shiny)
library(plotly)
library(tidyverse)
library(dplyr)
library(htmltools)

```


Home {data-icon="fa-home" .main}
=====================================

```{r, include=FALSE}

theme_set(theme_bw(base_size = 20))

```


Row
-----------------------------------------------------------------------

### Heading 1

```{r}
valueBox(1, icon = "fa-pencil", color="success")
```

### Heading 2

```{r}

valueBox(2, icon = "fa-file-text-o", color="info")

```

### Heading 3

```{r}
valueBox(3, icon = "fa-database", color = "danger")
```

Row
-------------------------------------------


Screen 2 {data-icon="fa-signal"}
==========================================================================

Sidebar {.sidebar data-width=350}
-------------------------------------

<h3>Selection Area</h3>

```{r}

hr(style = "border-top: 1px solid #000000;")

sliderInput("contact_rate", "Set contact rate", value = 91, min = 0, max = 100)

hr()

numericInput(inputId="my_input", "Enter a number:", 4, min = 0)

actionButton("submit", "Submit")


```


Value Boxes
-------------------------------------

### Primary

```{r}

observeEvent(input$submit, {
  arrow_icon_temp <- ifelse(input$my_input > 3, icon("fa-arrow-up", class = "text-success"),
                            icon("fa-arrow-down", class = "text-danger"))
  output$arrow <- renderValueBox({
    valueBox(
      input$my_input, caption = "Days",
      color = "white",
      icon = arrow_icon_temp
    )
  })
})


renderValueBox({
  valueBoxOutput("arrow")
})

```

### Info

```{r}

valueBox(2, caption = "Weeks", color = "red", icon = "fa-chart-line")

```

### Success

```{r}

valueBox(3, caption = "Weeks", color = "green", icon = "fa-chart-line")

```


Gauges
-------------------------------------

### Success Rate

```{r}

renderGauge({
  gauge(input$contact_rate, min = 0, max = 100, symbol = '%',
        sectors = gaugeSectors( danger = c(0, 20), warning = c(20, 80), success = c(80, 100)))
  })

```

### Warning metric

```{r}

renderGauge({
  gauge(input$contact_rate, min = 0, max = 100, symbol = '%',
        sectors = gaugeSectors( danger = c(0, 20), warning = c(20, 80), success = c(80, 100)))
  })

```

### Danger!

```{r}

renderGauge({
  gauge(input$contact_rate, min = 0, max = 100, symbol = '%',
        sectors = gaugeSectors( danger = c(0, 20), warning = c(20, 80), success = c(80, 100)))
  })


```
仪表板如下所示:
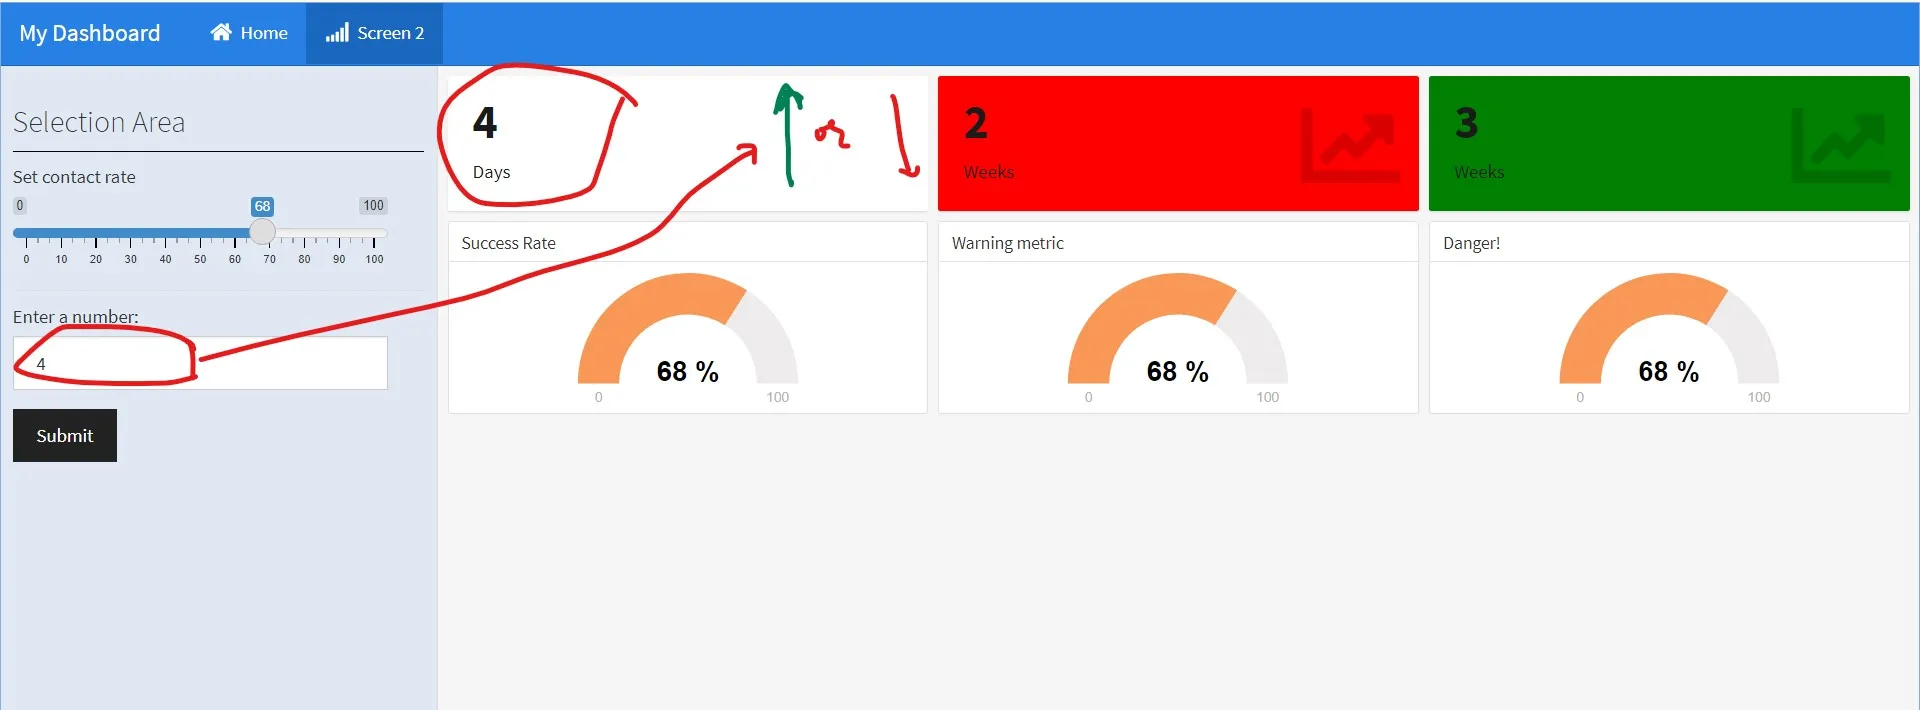
我试图通过响应式地改变值框中的向上箭头(绿色)或向下箭头(红色)或破折号(黑色),来实现当我在侧边栏的数值输入框中输入数字并点击提交按钮后,只有符合上述代码中应用的条件时,值框和箭头才会相应地改变(如图片所示)。
但是这里遇到了两个问题:
- 第一次启动仪表板(运行应用程序)时,需要提供输入数字,然后点击“提交”按钮,然后值框才会显示我刚刚输入的数字。
- 但是,第二次更改数字时,即使没有点击“提交”按钮,数字也会立即显示在值框中,这不应该发生。
- 箭头(红色、向下或绿色、向上)仍未被显示。
我在这里做错了什么?有什么建议吗?
valueBox中的caption一样,我是否也可以在显示的数字和箭头之间包含一个文本框,例如“错误:”?需要进行哪些微调? - LeMarquefa-arrows-left-right这种图标也可用就好了,我尝试过但没有成功...我还尝试了fa-dash(想用于当input$my_input == 3时的条件),但也没有成功...:'( - LeMarquefa-arrow-left、fa-arrow-right和fa-minus,它们都可以使用。 - David Jorquera