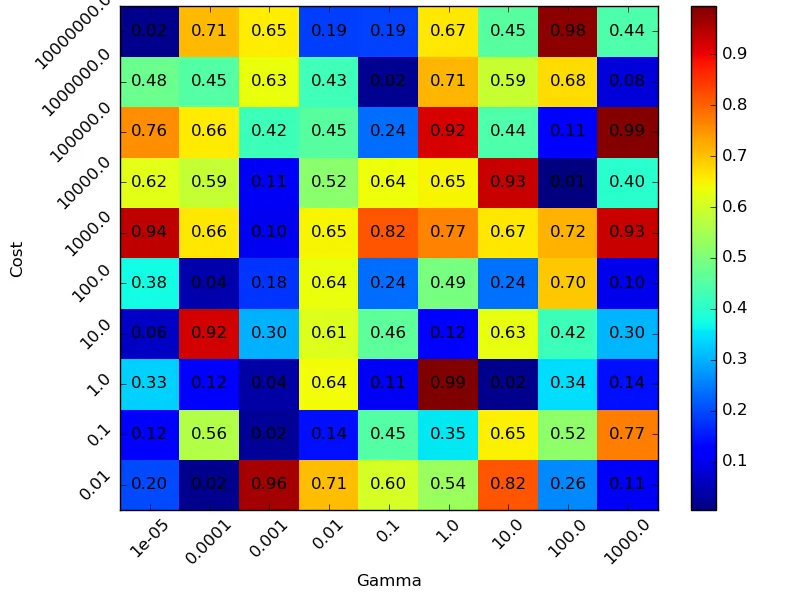
我正在使用matplotlib绘制热力图,就像下面的图片一样:
我需要将两个坐标轴的刻度和标签居中。有什么想法吗?
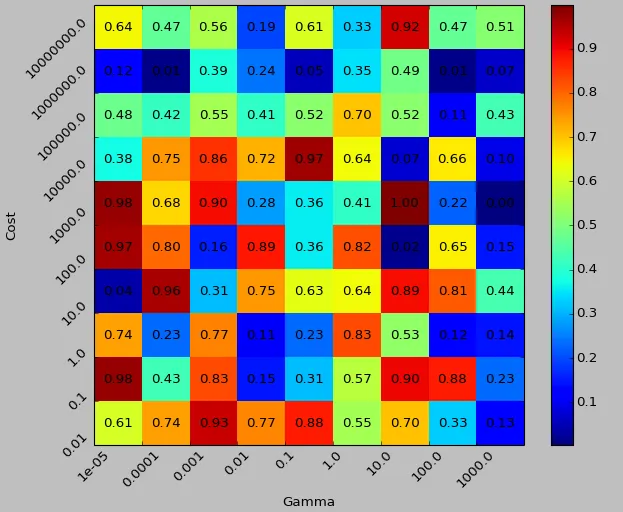
C_range = 10. ** np.arange(-2, 8)
gamma_range = 10. ** np.arange(-5, 4)

confMat=np.random.rand(10, 9)

heatmap = plt.pcolor(confMat)

for y in range(confMat.shape[0]):
    for x in range(confMat.shape[1]):
        plt.text(x + 0.5, y + 0.5, '%.2f' % confMat[y, x],
                horizontalalignment='center',
                verticalalignment='center',)


plt.grid()
plt.colorbar(heatmap)
plt.subplots_adjust(left=0.15, right=0.99, bottom=0.15, top=0.99)
plt.ylabel('Cost')
plt.xlabel('Gamma')

plt.xticks(np.arange(len(gamma_range)), gamma_range, rotation=45,)
plt.yticks(np.arange(len(C_range)), C_range, rotation=45)
plt.show()
我需要将两个坐标轴的刻度和标签居中。有什么想法吗?