1个回答
2
就像这样:
import pandas as pd
from numpy.random import random_integers
from numpy import reshape
import matplotlib.pyplot as plt
from matplotlib.ticker import FixedLocator, FixedFormatter
alph = 'ABCDEFGHIJKLMNOPQRSTUVWXYZ'
lalph = list(alph.lower())
alph = list(alph)

df = pd.DataFrame(random_integers(0,100,(26,26)),columns=alph,
                  index=lalph)

# Two lines just to make a plaid image in imshow
differ = reshape([sum(df[col2]-df[col]) for col2 in df for col in df], (26,26))
differ = pd.DataFrame(differ, columns=alph,index=alph)

# pick the labels you want
ticks = [2, 14, 18, 19, 22] # C=2 because A=0 because Python is 0-indexed
ticklabels = [alph[x] for x in ticks]

fig = plt.figure(figsize=(3,5))
ax = fig.add_subplot(111)
ax.imshow(differ)
ax.autoscale(False)

# display only the chosen ticks and ticklabels
ax.xaxis.set_major_locator(FixedLocator(ticks))
ax.xaxis.set_major_formatter(FixedFormatter(ticklabels))
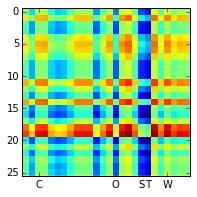
您将拥有一组字符串,这些字符串命名基因,而不是作为字母列表使用的字符串,但imshow轴索引仍然是基础numpy数组的索引。
- cphlewis
3
你如何绘制一个发夹或者横杠来表示'C'、'O'等的跨度? - mac389
1这些条形图将成为第二个子图上的条形图,该子图与主子图共享X轴;垂直线条勾勒它们,使其一直延伸到主图的边缘。联动子图可能是最简单的方法。主子图中的白色轮廓,矩形带有白色边缘颜色和无面颜色。这是标准数据的标准绘图类型吗? - cphlewis
这是基因表达数据的标准绘图类型。R可以绘制这些图形。我更喜欢Python,因为我分析多种类型的数据,并且我发现Python代码更易于阅读。 - mac389
网页内容由stack overflow 提供, 点击上面的可以查看英文原文,
原文链接
原文链接
ax.xticks',ax.set_xticklabels` 可能已经足够了。 - cphlewis