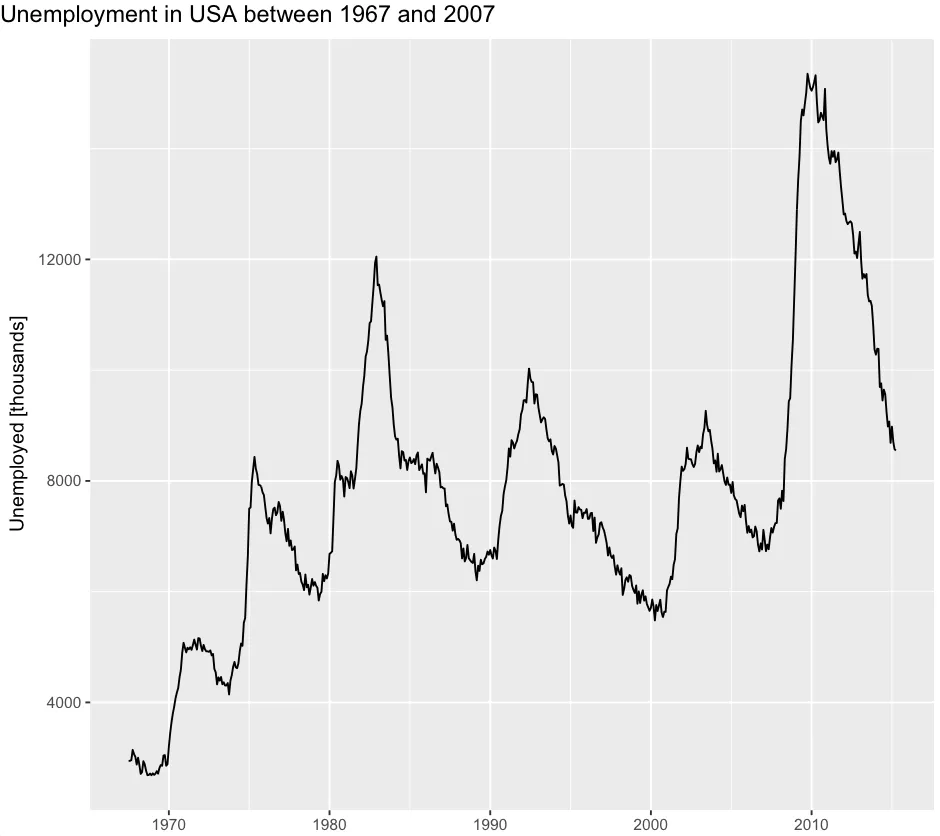
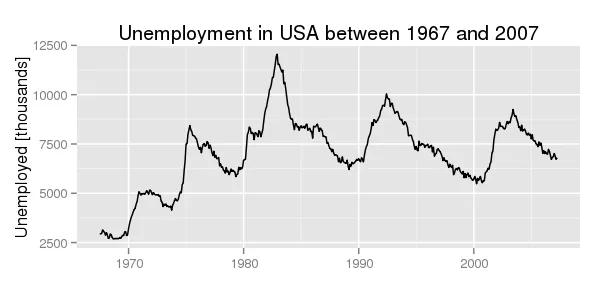
我想要像这样的图中左对齐标题
ggplot(data = economics, aes(x = date, y = unemploy)) +
 geom_line() +
 ggtitle("Unemployment in USA between 1967 and 2007") +
 xlab("") +
 ylab("Unemployed [thousands]")
第一次尝试
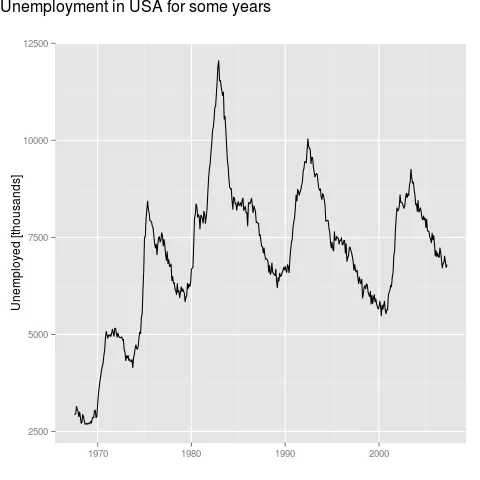
ggplot(data = economics, aes(x = date, y = unemploy)) + geom_line() +
 ggtitle("Unemployment in USA for some years") +
 xlab("") +
 ylab("Unemployed [thousands]") +
 theme(plot.title = element_text(hjust = -0.45, vjust=2.12)))
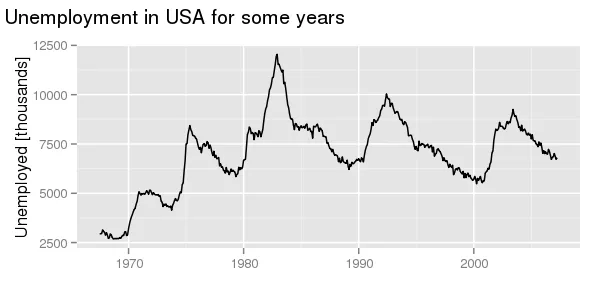
太棒了,成功了!但是等等……还有更多的事情……现在我想把标题改成别的什么。
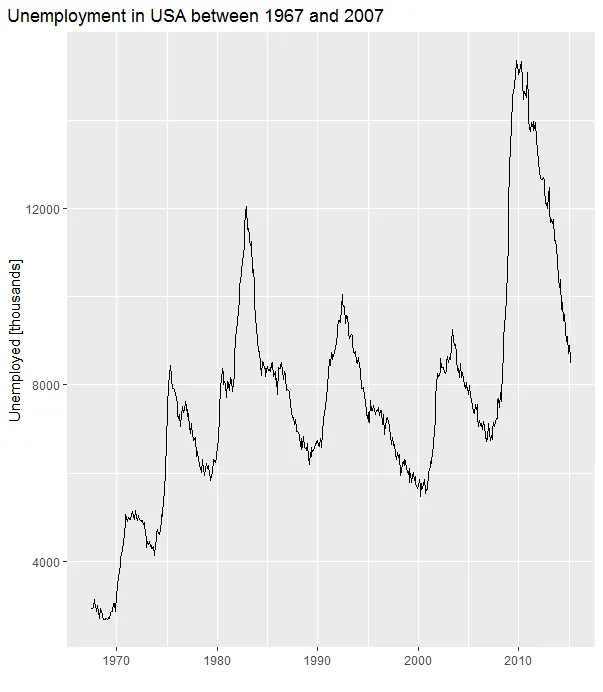
ggplot(data = economics, aes(x = date, y = unemploy)) +
 geom_line() +
 ggtitle("Unemployment in USA between 1967 and 2007") +
 xlab("") +
 ylab("Unemployed [thousands]") +
 theme(plot.title = element_text(hjust = -0.45, vjust=2.12))
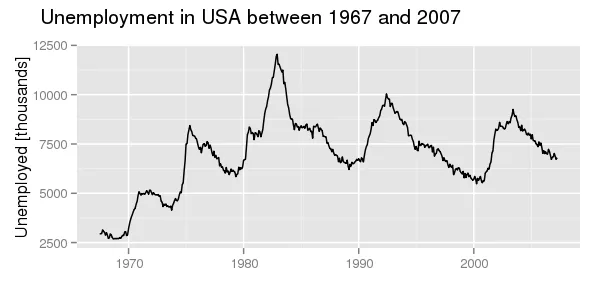
现在我需要调整 hjust... :(
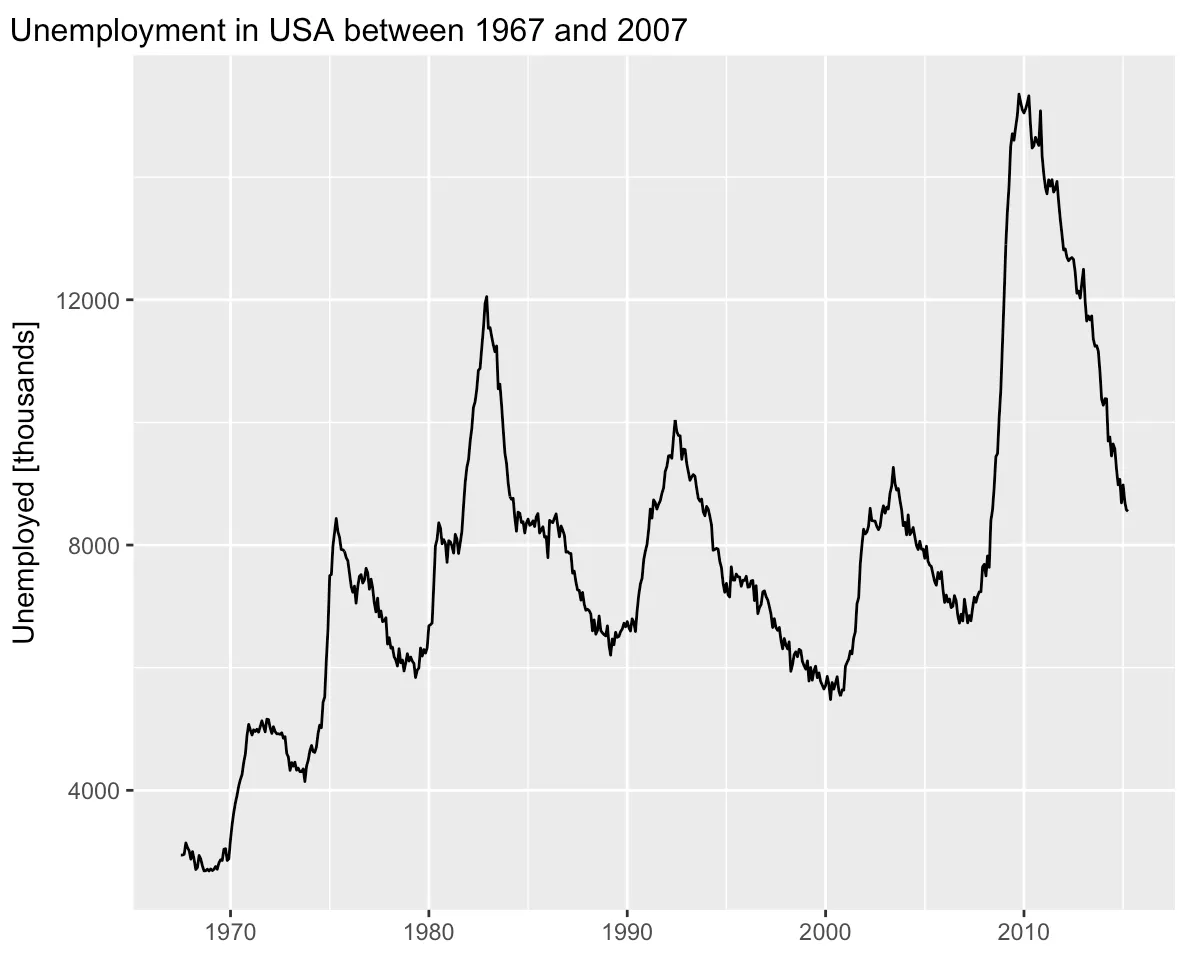
问题
如何使标题左对齐(大约比 y 轴标签左侧多几个像素),并且可以一次又一次地重复此操作,而不会影响 hjust 的值?或者说 hjust 和字符串长度之间的关系是什么?
我已经尝试根据 这个问题 手动注释,但由于某种原因只得到了标题而没有别的内容-还出现了一个错误。
谢谢!