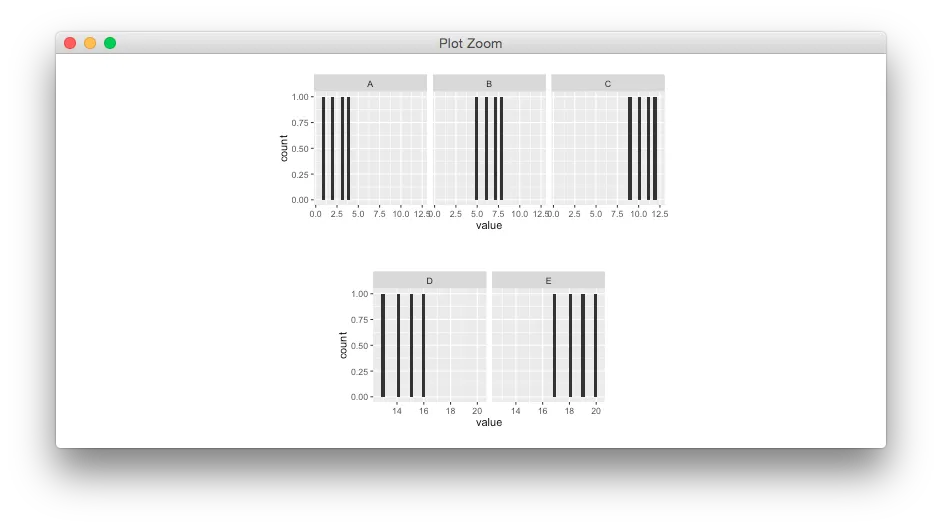
我正在为一份报告创建多个分面图。每个图的分面数量在2到8之间变化。理想情况下,我希望每个分面(跨图)的绝对大小相同(例如4x4厘米),这样更容易比较它们(而且看起来更好看)。
这可能吗?
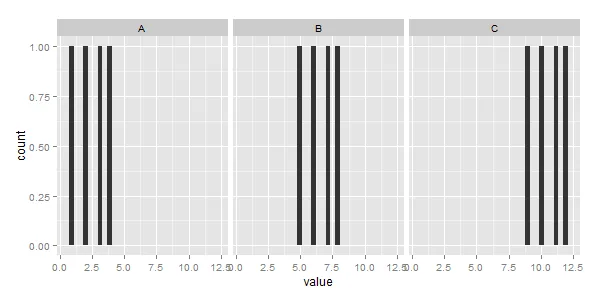
df1 <- structure(list(group1 = structure(c(1L, 1L, 1L, 1L, 1L, 1L, 1L,1L, 1L, 1L, 1L, 1L), .Label = c("S1", "S2"), class = "factor"), group = structure(c(1L, 1L, 1L, 1L, 2L, 2L, 2L, 2L, 3L, 3L, 3L, 3L), .Label = c("A", "B", "C", "D", "E"), class = "factor"), value = 1:12), class = "data.frame", row.names = c(NA, -12L), .Names = c("group1", "group", "value"))
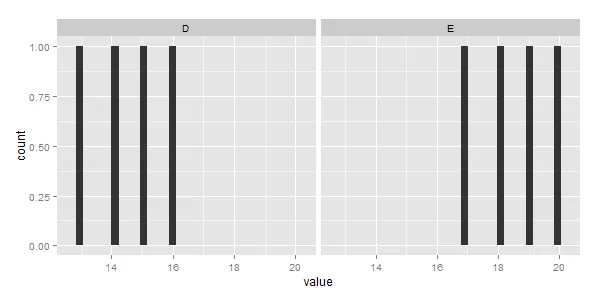
df2 <- structure(list(group1 = structure(c(2L, 2L, 2L, 2L, 2L, 2L, 2L, 2L), .Label = c("S1", "S2"), class = "factor"), group = structure(c(4L, 4L, 4L, 4L, 5L, 5L, 5L, 5L), .Label = c("A", "B", "C", "D", "E"), class = "factor"), value = 13:20), class = "data.frame", row.names = c(NA, -8L), .Names = c("group1", "group", "value"))
library(ggplot2)
plot1 <- ggplot(df1) + geom_histogram(aes(x=value)) + facet_wrap(~group)
plot2 <- ggplot(df2) + geom_histogram(aes(x=value)) + facet_wrap(~group)
g$widths[panel_index_w] <- rep(list(width), nw)。我需要使用这个:g$widths[panel_index_w] <- rep(grid:::unit.list(width), nw)。 - Claus Wilkeg$widths[panel_index_w] <- rep(list(width), nw)这一行替换为g$widths[panel_index_w] <- rep(width, nw)。然后就可以正常工作了。 - Claus Wilkeset_panel_size也可以在 @baptiste 的包 egg 中找到。 - jan-glx