有没有一种简单的方法可以将瓦夫尔图与ggplot2中的分面组合使用,或者与waffle包进行组合?例如,将下面的每个条形图替换为100个正方形,以表示1%。
ggplot(mtcars, aes(x = factor(vs), y = hp, fill = as.factor(carb))) +
  geom_bar(stat = 'identity', position = 'fill') +
  facet_wrap('gear')
有没有一种简单的方法可以将瓦夫尔图与ggplot2中的分面组合使用,或者与waffle包进行组合?例如,将下面的每个条形图替换为100个正方形,以表示1%。
ggplot(mtcars, aes(x = factor(vs), y = hp, fill = as.factor(carb))) +
geom_bar(stat = 'identity', position = 'fill') +
facet_wrap('gear')
我不确定我是否会用stat_waffle() / geom_waffle(),但是你可以使用该软件包中的逻辑来绕过长路做同样的事情:
library(hrbrthemes)
library(tidyverse)
我们需要弄清楚百分比,然后让每个组加起来总共达到100,因此我们需要一个在SO上已经存在一段时间的辅助函数:
smart_round <- function(x, digits = 0) { # somewhere on SO
  up <- 10 ^ digits
  x <- x * up
  y <- floor(x)
  indices <- tail(order(x-y), round(sum(x)) - sum(y))
  y[indices] <- y[indices] + 1
  y / up
}
Waffle包中有两个“魔法”比特。一个比特是算法的一部分,它只是将因子组件复制正确的次数。我们将按行应用以下函数到我们将要创建的数据框中:
waffleize <- function(xdf) {
  data_frame(
    gear_vs = rep(xdf$gear_vs, xdf$pct),
    carb = rep(xdf$carb, xdf$pct)
  )
}
现在我们需要:
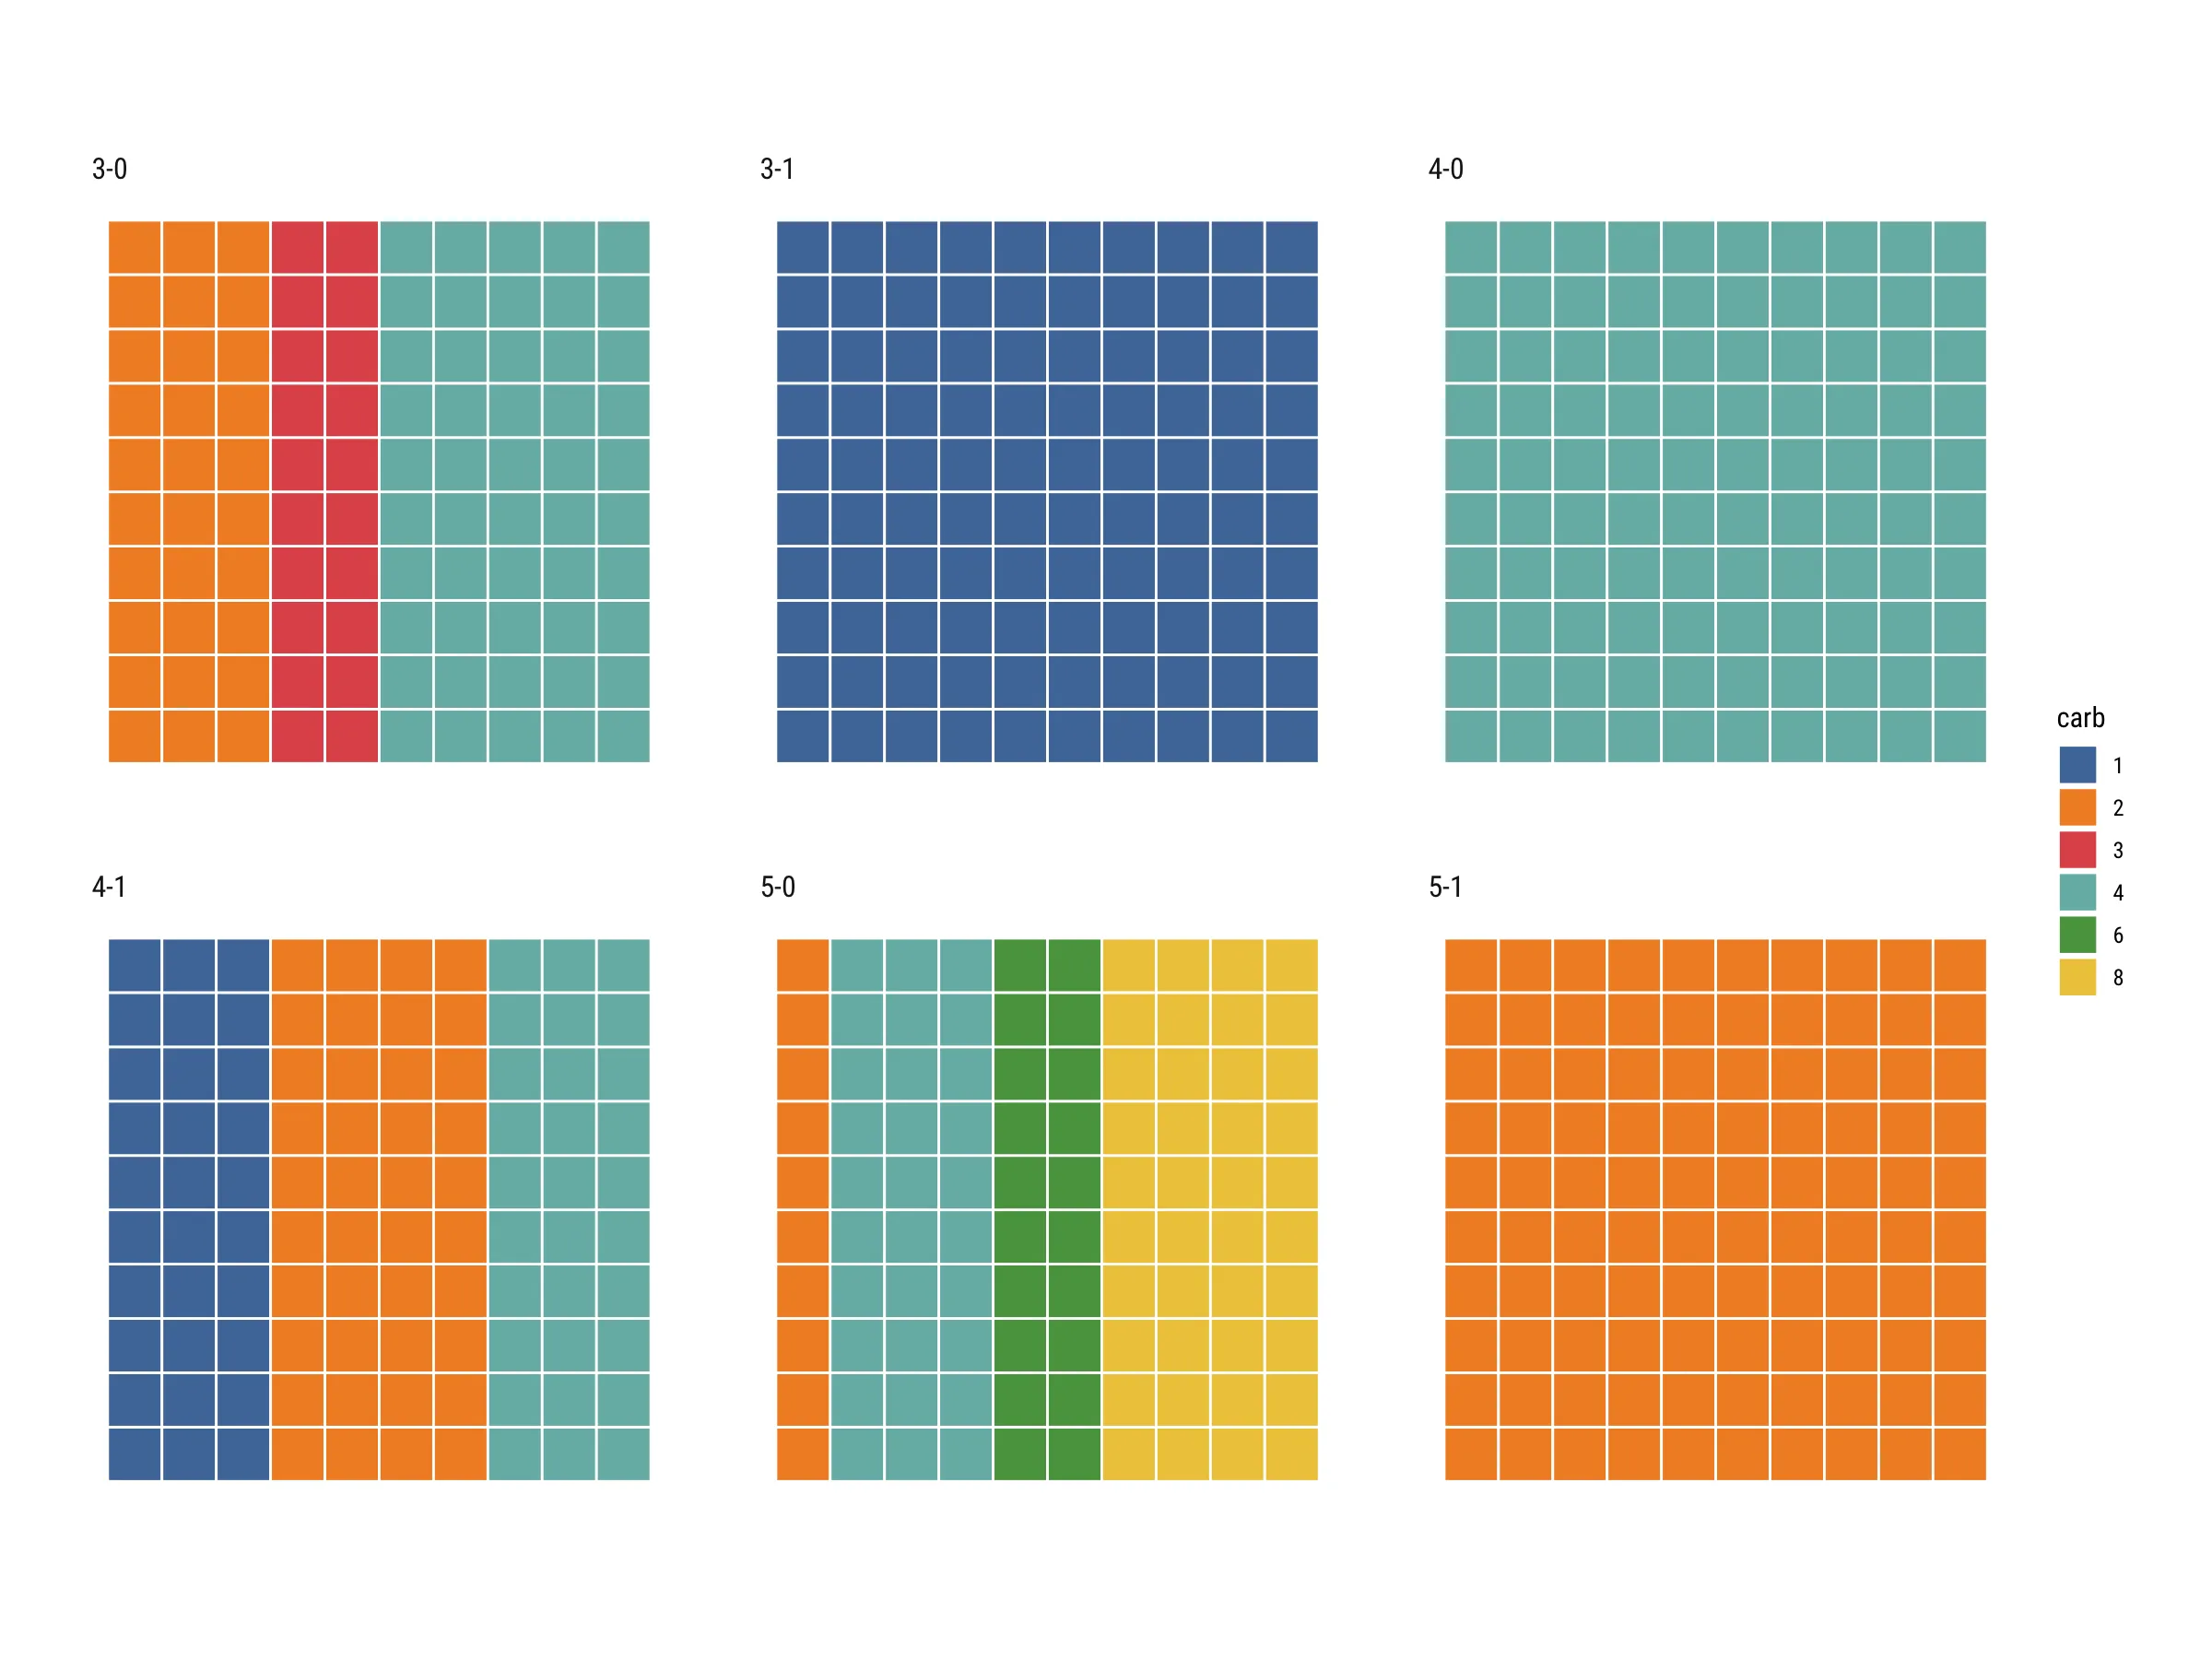
geom_tile(),我们需要伪造一个可以实现相同功能的facet名称pct次x/y网格,因为我们将有多少个facet(在本例中为6);这是waffle包的“魔术”的另一部分^^ 翻译成:(这个管道链对我来说有点长,但是“它有效”)
count(mtcars, gear, vs, carb, wt=hp) %>%
  group_by(gear, vs) %>%
  mutate(pct = n/sum(n)) %>%
  mutate(pct = (smart_round(pct, 1) * 100L) %>%  as.integer()) %>%
  select(-n) %>%
  ungroup() %>%
  mutate(carb = as.character(carb))  %>%
  mutate(gear_vs = sprintf("%s-%s", gear, vs)) %>%
  select(gear_vs, carb, pct, -gear, -vs) %>%
  rowwise() %>%
  do(waffleize(.)) %>%
  ungroup() %>%
  arrange(gear_vs, carb) %>%
  bind_cols(
    map_df(seq_len(length(unique(.$gear_vs))), ~expand.grid(y = 1:10, x = 1:10))
  ) %>%
  ggplot(aes(x, y)) +
  geom_tile(aes(fill=carb), color="white", size=0.5) +
  ggthemes::scale_fill_tableau() +
  facet_wrap(~gear_vs) +
  coord_equal() +
  labs(x=NULL, y = NULL) +
  hrbrthemes::theme_ipsum_rc(grid="") +
  theme(axis.text=element_blank())
对于@hrbrmstr的出色回答(感谢您制作此软件包并与我们分享代码!),我有一个小补充。我也曾努力制作这样的图表,因为我认为这是比饼状图更好的可视化数据比较的方式。我的华夫饼图哲学与现有解决方案(waffle和ggwaffle)有三个不同之处:
ggplot2 proto对象将是不错的,但尝试后我不得不放弃。我对proto系统的理解还不够,无法编写相关代码。一旦我添加了所有我计划添加的功能(计划是使华夫饼图类似于scatterpie),我只需复制我打算包含在我的R包中的代码即可。请注意,下面大部分代码都是用来美化华夫饼图的。制作华夫饼图的部分并不那么复杂,并且在@hrbrmstr的答案中有很好的解释。library(dplyr)
library(ggplot2)
#' @title Convert line sizes measured as points to ggplot line sizes
#' @description Converts line sizes measured as points (as given by most programs such as Adobe Illustrator etc.) to ggplot font sizes
#' @param x numeric vector giving the lines sizes in points
#' @return Returns a numeric vector of lenght \code{x} of ggplot line sizes
#' @keywords internal
#' @export
#'
LS <- function(x) x/2.13
#' @title Round values preserving total sums
#' @description The function rounds values preserving total sums
#' @param x numeric vector of values to be rounded
#' @param digits integer indicating the number of decimal places. See \code{\link[base]{round}}.
#' @return Returns a numeric vector.
#' @author The function is written as a communal effort. Main authors are \href{https://dev59.com/hVwY5IYBdhLWcg3wgX-V and \href{https://www.r-bloggers.com/round-values-while-preserve-their-rounded-sum-in-r/}{BioStatMatt}.
#' @keywords internal
#' @family waffle
#' @export
round_preserve_sum <- function(x, digits = 0) {
up <- 10 ^ digits
x <- x * up
y <- floor(x)
indices <- tail(order(x-y), round(sum(x)) - sum(y))
y[indices] <- y[indices] + 1
y / up
} # from https://www.r-bloggers.com/round-values-while-preserve-their-rounded-sum-in-r/
#' @title Prepare data for waffle plots
#' @description Manipulates a data frame ready for plotting with the \code{\link{waffle_chart}} function.
#' @param dt data frame containing the data which should be transformed
#' @param fill character specifying the column name which should be used as fill for the waffle plot.
#' @param value character specifying the column name which contains values of the \code{fill} variable.
#' @param composition logical indicating whether a compositional waffle (i.e. fill adds up to 100\%) should be created. If \code{FALSE}, waffle cells will be scaled to \code{max_value} and missing cells filled with an "empty" category.
#' @param max_value numerical giving the value to which waffle cells should be scaled to, if \code{composition = FALSE}.
#' @param digits integer indicating the number of decimal places to be used in rounding of the waffle cells.
#' @return returns a \link[tibble]{tibble} data frame containing the minimum and maximum extent of each \code{fill} level.
#' @author Mikko Vihtakari
#' @keywords internal
#' @family waffle
#' @import dplyr
#' @export
waffleize <- function(dt, fill, value, composition = TRUE, max_value = NULL, digits = 3) {
x <- dt[c(fill, value)]
names(x) <- c("variable", "value")
if(composition) {
x$value <- round_preserve_sum(10^digits*x$value/sum(x$value))
} else {
if(is.null(max_value)) stop("max_value has to be given, if composition = FALSE")
if(max_value < sum(x$value)) stop("max_value has to be larger than the sum of 'value' column. Use composition = TRUE, if you want a compositional waffle chart")
x <- rbind(x, data.frame(variable = "empty", value = max_value - sum(x$value)))
x$value <- round_preserve_sum(10^digits*x$value/max_value)
}
if(!is.factor(x$variable)) x$variable <- factor(x$variable, levels = c(sort(unique(x$variable)[unique(x$variable) != "empty"]), "empty"))
x <- x[order(x$variable),]
#tmp <- data.frame(X = 1:100, ymin = rep(c(0, (1:9)*10), each = 100), ymax = rep((1:10)*10, each = 100), variable = rep(dt[[fill]], dt[[value]]))
tmp <- data.frame(X = 1:10^(digits-1), ymin = rep(c(0, (1:9)*10^(digits-2)), each = 10^(digits-1)), ymax = rep((1:10)*10^(digits-2), each = 10^(digits-1)), variable = rep(x$variable, x$value))
out <- tmp %>% group_by(variable, ymin, ymax) %>% summarise(xmin = min(X)-1, xmax = max(X))
## Remove the empty category
out[out$variable != "empty",]
}
#' @title Plot waffle charts
#' @description The function uses \link[ggplot2]{ggplot2} to create waffle charts from data.
#' @param data data frame to be plotted
#' @param fill character specifying the column name which should be used as fill for the waffle plot.
#' @param value character specifying the column name which contains values of the \code{fill} variable. Will be used to fill the waffle cells.
#' @param facet character specifying the column name which should be used to \code{\link[ggplot2]{facet_wrap}} waffle charts.
#' @param ncol number of columns to be used in facetting. See \code{\link[ggplot2]{facet_wrap}}.
#' @param composition logical indicating whether a compositional waffle (i.e. fill adds up to 100\%) should be created. If \code{FALSE}, waffle cells will be scaled to \code{max_value} and missing cells filled with an "empty" category.
#' @param max_value numerical giving the value to which waffle cells should be scaled to, if \code{composition = FALSE}.
#' @param digits integer indicating the number of decimal places to be used in rounding of the waffle cells. The value 3 indicates percentages, while 4 permilles.
#' @param fill_colors named character vector giving the colors for \code{fill} levels. See \code{\link[ggplot2]{scale_fill_manual}}.
#' @param fill_title character giving the title for the color legend.
#' @param base_size numeric giving the base size for the plot. See \code{\link[ggplot2]{theme_void}}.
#' @param legend.position character specifying the position of the legend. See \code{\link[ggplot2]{ggtheme}}.
#' @details The waffle charts are read from left to right (like text) and from bottom upwards (like water glass). The cells indicate 1\% of the maximum value (100% if \code{composition = TRUE} else \code{max_value}). The cells are divided vertically to fractions specifies by the \code{digits} argument.
#' @return Returns a \link[ggplot2]{ggplot2} waffle plot
#' @import ggplot2 dplyr
#' @family waffle
#' @author Mikko Vihtakari with code ideas from \href{https://github.com/hrbrmstr/waffle}{hrbrmstr} and \href{https://github.com/liamgilbey/ggwaffle}{Liam Gilbey}
#' @export
# data = dt; fill = "variable"; value = "value"; facet = NULL; composition = TRUE; max_value = NULL; digits = 3; fill_colors = NULL; fill_title = NULL; ncol = NULL; base_size = 12; legend.position = "bottom"
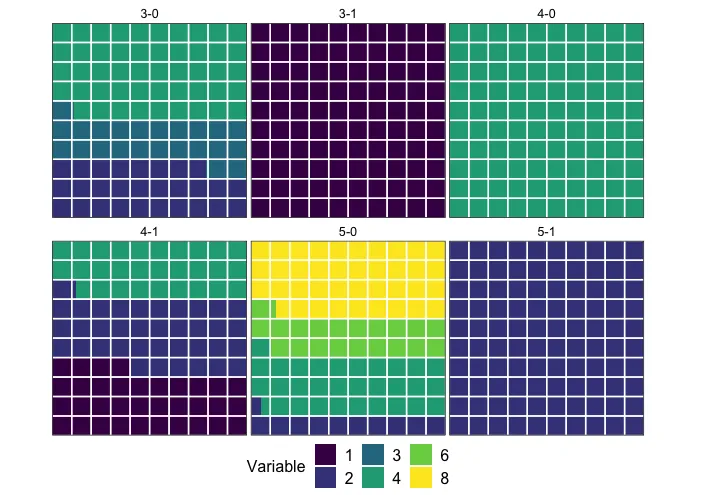
waffle_chart <- function(data, fill, value = "value", facet = NULL, composition = TRUE, max_value = NULL, digits = 3, fill_colors = NULL, fill_title = NULL, ncol = NULL, base_size = 12, legend.position = "bottom") {
## White 1% grid
grid_data <- data.frame(xmin = c(0,(1:9)*10^(digits-2)), xmax = (1:10)*10^(digits-2), ymin = rep(c(0,(1:9)*10^(digits-2)), each = 10^(digits-2)), ymax = rep((1:10)*10^(digits-2), each = 10^(digits-2)))
if(is.null(facet)) { ## No facetting
if(any(duplicated(data[[fill]]))) stop("data contains duplicated entries in fill column. Use the facet argument or summarize data before plotting.")
waffle_data <- waffleize(dt = data, fill = fill, value = value, composition = composition, max_value = max_value, digits = digits)
## Plot ####
p <- ggplot() +
geom_rect(data = waffle_data, aes(xmin = xmin, xmax = xmax, ymin = ymin, ymax = ymax, fill = variable)) +
geom_rect(data = grid_data, aes(xmin = xmin, xmax = xmax, ymin = ymin, ymax = ymax), fill = NA, color = "white") +
coord_equal(expand = FALSE) +
theme_void()
## ####
} else { ## Facetting
waffle_data <- data %>% group_by_(facet) %>% do(waffleize(dt = ., fill = fill, value = value, composition = composition, max_value = max_value, digits = digits))
## Plot ####
p <- ggplot() +
geom_rect(data = waffle_data, aes(xmin = xmin, xmax = xmax, ymin = ymin, ymax = ymax, fill = variable)) +
geom_rect(data = grid_data, aes(xmin = xmin, xmax = xmax, ymin = ymin, ymax = ymax), fill = NA, color = "white") +
facet_wrap(facet, ncol = ncol) +
coord_equal(expand = FALSE) +
theme_void()
## ####
}
## Fill colors ####
if(is.null(fill_title)) fill_title <- "Variable"
if(!is.null(fill_colors)) {
p <- p + scale_fill_manual(name = fill_title, values = fill_colors)
} else {
p <- p + scale_fill_viridis_d(name = fill_title)
}
## Final theme manipulation
p <- p + theme(
legend.position = legend.position,
aspect.ratio = 1,
panel.border = element_rect(color = "black", size = LS(1), fill = NA),
strip.background = element_rect(fill = alpha("white", 0.4), color = NA),
strip.text.x = element_text(size = base_size*0.8, margin = margin(t = 2, r = 0, b = 3, l = 0, unit = "pt")),
plot.title = element_text(size = base_size, hjust = 0.5, face = 2),
legend.background = element_blank(),
legend.box.background = element_blank(),
legend.title = element_text(size = base_size),
legend.text = element_text(size = base_size),
plot.background = element_blank(),
panel.spacing = unit(0.2, units = "line"),
legend.box.margin = margin(t = 0, r = 0, b = 3, l = 0, unit = "pt"),
plot.margin = unit(c(0.2, 0.5, 0.1, 0.1), units = "line")
)
## Return the plot
p
}
# Manipulate the dataset first to make sure that there are no replicate
# entries of factors used for the waffles

data("mtcars")

mtcars$gear_vs <- paste(mtcars$gear, mtcars$vs, sep = "-")
mtcars$carb <- factor(mtcars$carb)
x <- mtcars %>% group_by(gear_vs, carb) %>% summarise(value = sum(hp))

waffle_chart(x, fill = "carb", facet = "gear_vs", value = "value")
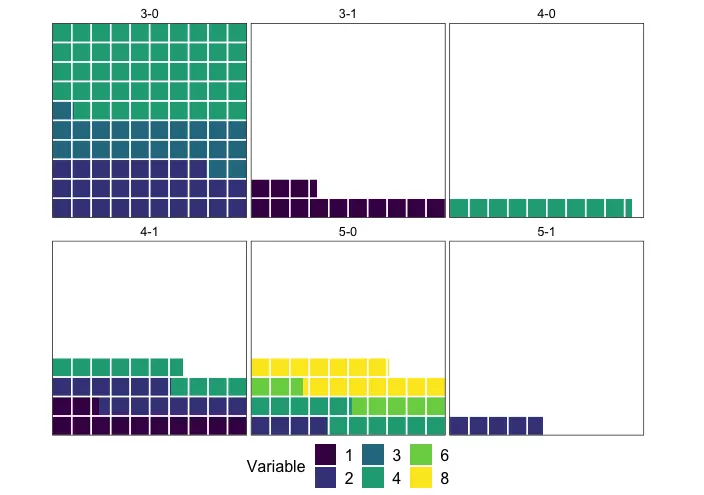
## You can also scale the waffles to a maximum hp in gear_vs

y <- x %>% group_by(gear_vs) %>% summarise(value = sum(value))

waffle_chart(x, fill = "carb", facet = "gear_vs", value = "value", composition = FALSE, max_value = max(y$value))
这里提供了一种替代方法,只使用tidyverse(即dplyr、tidyr和ggplot2)来创建waffle plot或square pie chart。它基于hrbrmstr's answer,但我试图使其更加通用; 任何频率表都可以作为输入,并且很容易调整华夫饼的尺寸(例如矩形而不是正方形)。
library(tidyverse)
freq_table = mtcars %>%
  count(gear, vs, carb, wt = hp) %>%
  group_by(gear, vs) %>%
  mutate(pct = n / sum(n)) %>%
  select(gear, vs, carb, pct)
tidyr::expand()而不是waffleize()。仍然使用smart_round()。waffle.n = 100 # Number of blocks
waffle.cols = ceiling(sqrt(waffle.n)) # For square. Otherwise pick integer.
coordinates = freq_table %>%
group_by(gear, vs) %>%
mutate(waffle.num = smart_round(pct,1) * waffle.n) %>%
group_by(carb, gear, vs) %>%
expand(count = seq(1:waffle.num)) %>%
select(-count) %>%
group_by(gear, vs) %>%
arrange(gear, vs) %>%
mutate(
waffle.x = rep_len(1:waffle.cols, waffle.n),
waffle.y = floor((row_number() - 1) / waffle.cols)
)
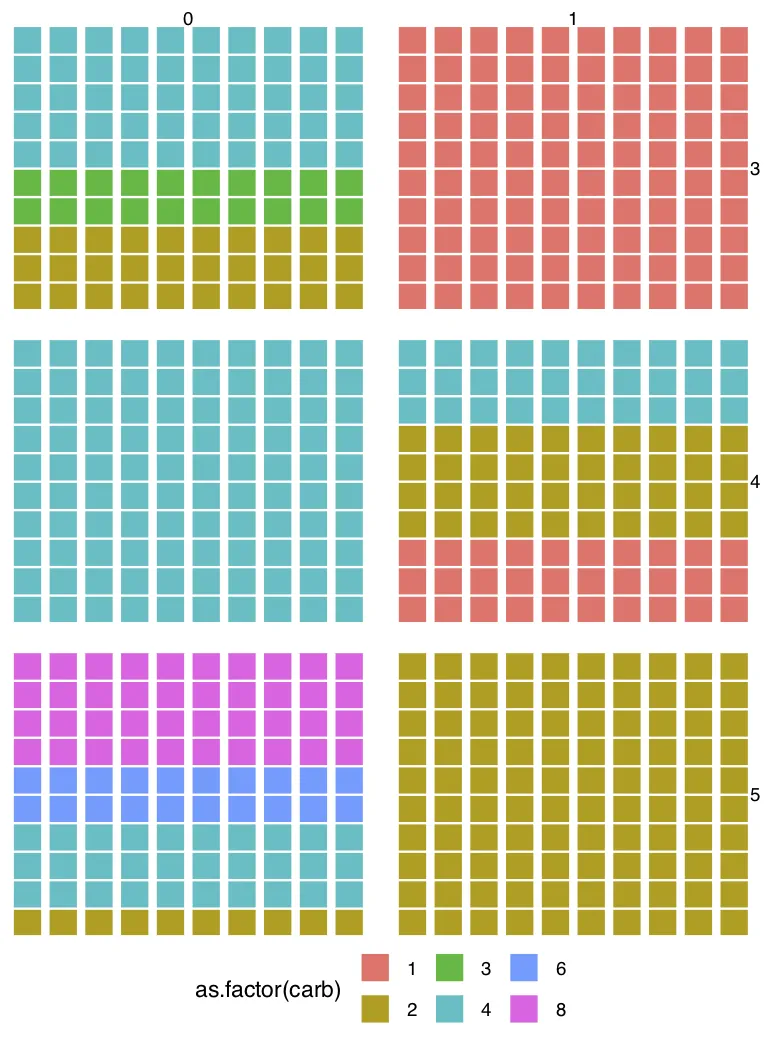
gear 和 vs) 进行分组,因此使用了 facet_grid()。如果您只需要按单个变量进行分组,则可以使用 facet_wrap()。您需要微调选项以获得最佳结果(例如设备大小、点的大小和笔画)。fig = coordinates %>%
ggplot(aes(x = waffle.x, y = waffle.y, fill = as.factor(carb))) +
geom_point(size = 7, shape = 22, color = "white", stroke = 0.8) +
#geom_raster() + # Alternative to geom_point() without gap between blocks.
facet_grid(rows = vars(gear), cols = vars(vs)) +
theme_void() +
theme(legend.position = "bottom", plot.margin = margin(5.5, 5.5, 5.5, 5.5, "pt"), panel.spacing = unit(15, "pt"))
fig
#ggsave("fig.pdf", width = 13, height = 17.5, units = "cm", dpi = 150)
一个更有趣的例子,其中块数不均匀且份额不可被10整除。
waffle.n并使用类似于 geom_raster(hjust=0, vjust=0) + geom_vline(xintercept=seq(0,waffle.cols,by=2), color="white") + geom_hline(yintercept=seq(0,waffle.cols-1,by=1), color="white") 而不是 geom_point() 来实现。 - bonna