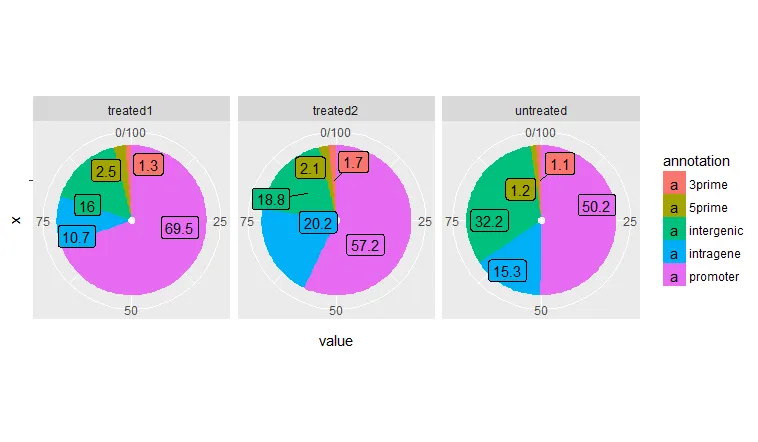
我正在使用ggplot2绘制多个饼图,并成功地将标签绘制在正确的位置,如下所示:
df <- data.frame(annotation=rep(c("promoter", "intergenic", "intragene", "5prime", "3prime"), 3), value=c(69.5, 16, 10.7, 2.5, 1.3, 57.2, 18.8, 20.2, 2.1, 1.7, 50.2, 32.2, 15.3, 1.2, 1.1), treatment=rep(c("treated1", "treated2", "untreated"), c(5, 5, 5)))

library(ggplot2)

ggplot(data = df, aes(x = "", y = value, fill = annotation)) +
geom_bar(stat = "identity") +
geom_text(aes(label = value), position = position_stack(vjust = 0.5)) +
coord_polar(theta = "y") +
facet_grid(.~treatment)
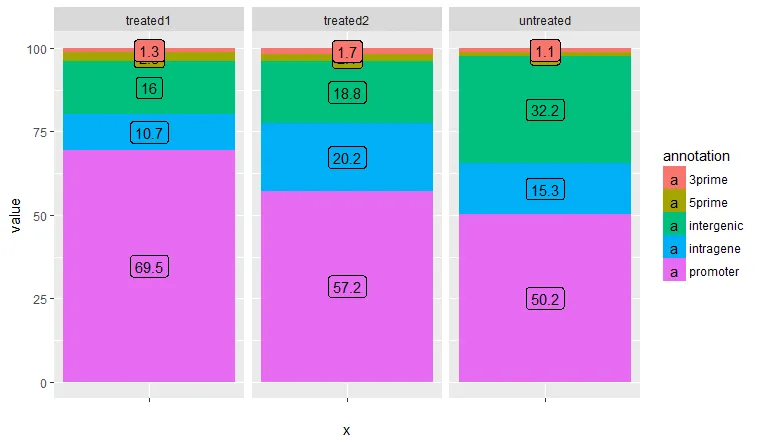
我随后想要使用ggrepel,以避免小的切片数字重叠:
library(ggrepel)

ggplot(data = df, aes(x = "", y = value, fill = annotation)) +
geom_bar(stat = "identity") +
geom_text_repel(aes(label = value), position = position_stack(vjust = 0.5)) +
coord_polar(theta = "y") +
facet_grid(.~treatment)
但是我得到了以下警告:
"警告:忽略未知参数:position"
并且标签混乱了。
有人知道如何将标签的正确定位与geom_text_repel结合起来,或者是否有其他替代方案?
谢谢!
sessionInfo()
R version 3.3.2 (2016-10-31)
Platform: x86_64-redhat-linux-gnu (64-bit)
Running under: Scientific Linux 7.2 (Nitrogen)

locale:
 [1] LC_CTYPE=en_US.UTF-8       LC_NUMERIC=C
 [3] LC_TIME=en_US.UTF-8        LC_COLLATE=en_US.UTF-8
 [5] LC_MONETARY=en_US.UTF-8    LC_MESSAGES=en_US.UTF-8
 [7] LC_PAPER=en_US.UTF-8       LC_NAME=C
 [9] LC_ADDRESS=C               LC_TELEPHONE=C
 [11] LC_MEASUREMENT=en_US.UTF-8 LC_IDENTIFICATION=C

attached base packages:
[1] stats     graphics  grDevices utils     datasets  methods   base

other attached packages:
[1] ggrepel_0.6.5 ggplot2_2.2.1 limma_3.26.9

loaded via a namespace (and not attached):
 [1] Rcpp_0.12.8      digest_0.6.12    grid_3.3.2       plyr_1.8.4
 [5] gtable_0.2.0     magrittr_1.5     scales_0.4.1     stringi_1.1.5
 [9] reshape2_1.4.2   lazyeval_0.2.0   labeling_0.3     tools_3.3.2
 [13] stringr_1.2.0    munsell_0.4.3    colorspace_1.3-2 tibble_1.3.0
geom_label_repel(aes(label = value, y = text_y), nudge_x = 1.6)或者使用其他值。 - Andrey Kolyadin