这是代码:
require(ggplot2)
require(grid)
# pdf("a.pdf")
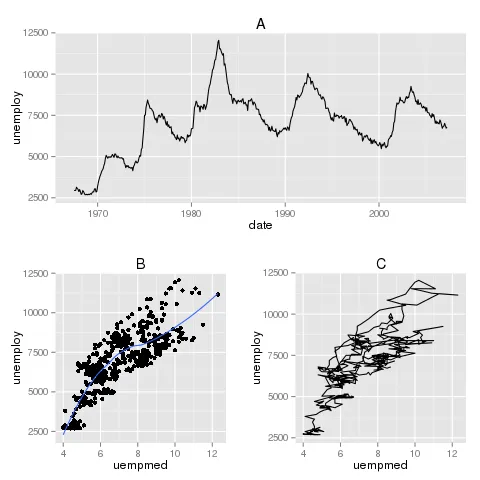
png('a.png')
a <- qplot(date, unemploy, data = economics, geom = "line") + opts(title='A')
b <- qplot(uempmed, unemploy, data = economics) + geom_smooth(se = F) + opts(title='B')
c <- qplot(uempmed, unemploy, data = economics, geom="path") + opts(title='C')
grid.newpage()
pushViewport(viewport(layout = grid.layout(2, 2)))
vplayout <- function(x, y) viewport(layout.pos.row = x, layout.pos.col = y)
print(a, vp = vplayout(1, 1:2))
print(b, vp = vplayout(2, 1))
print(c, vp = vplayout(2, 2))
dev.off()
并且结果:
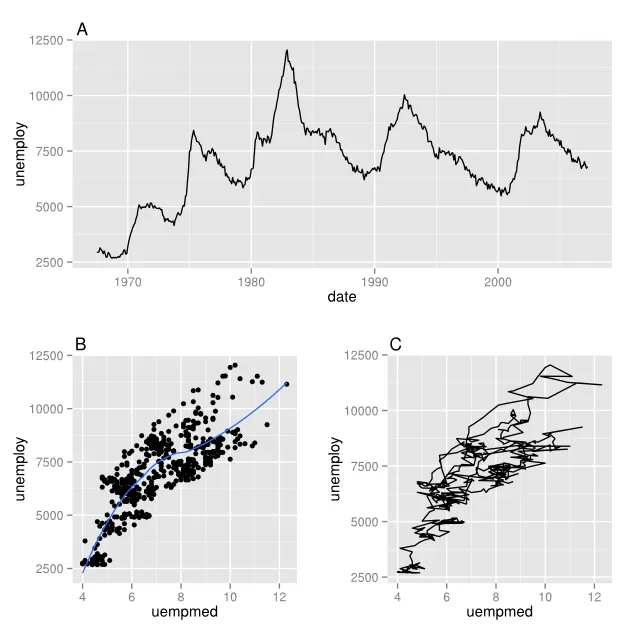
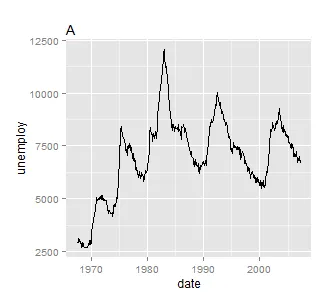
而我希望拥有这样的效果,即将标题位置放在y轴的顶部附近:
opts而不是theme。 - Tyler Rinker