在子图网格中重新定位一个子图

11

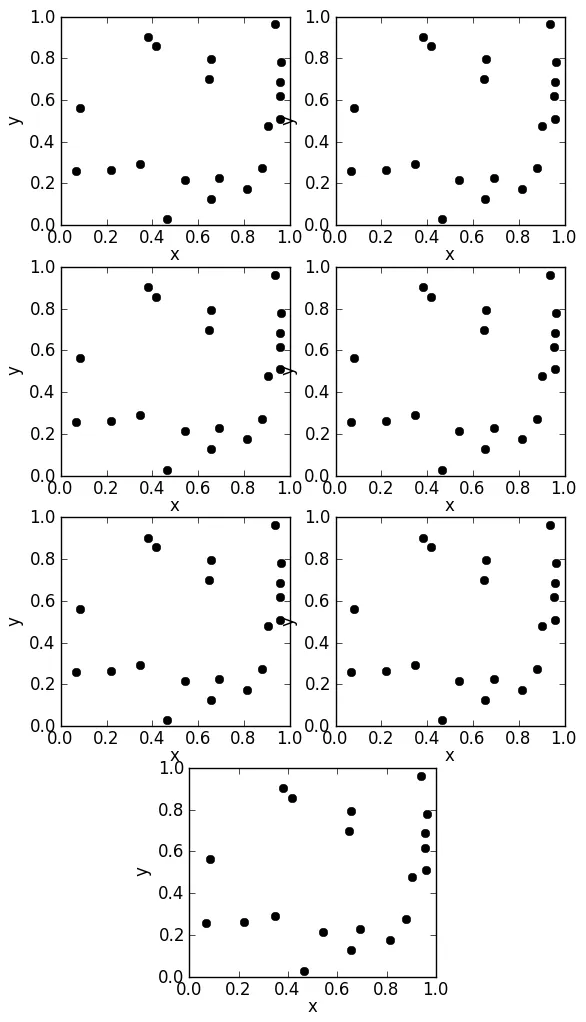
我正试图制作一个包括7个子图的绘图。目前,我正在绘制两列,一列有四个图形,另一列有三个,就像这样:
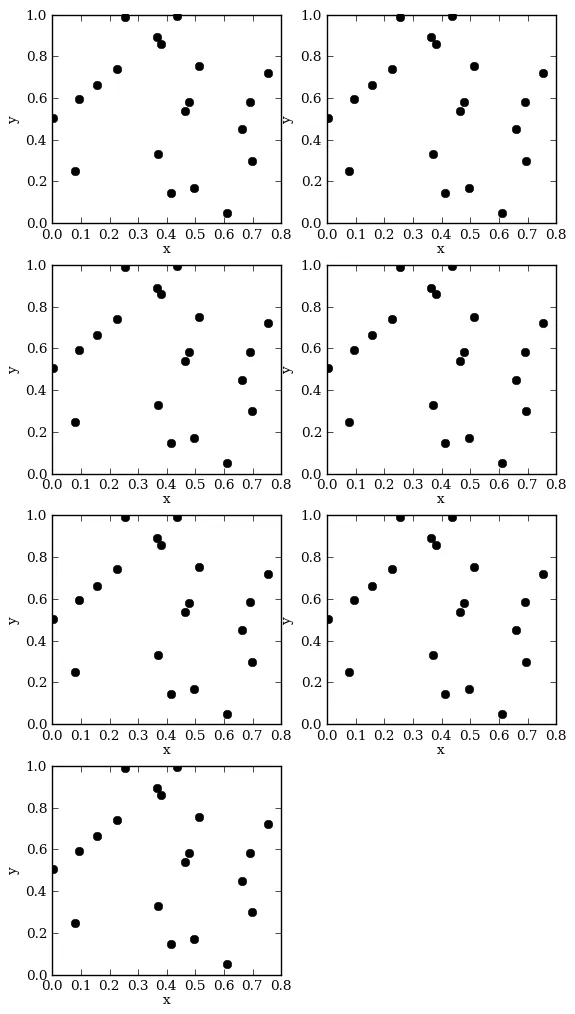
enter image description here

我是按照以下方式构建这个绘图的:

    #! /usr/bin/env python
    import numpy as plotting
    import matplotlib
    from pylab import *
    x = np.random.rand(20)
    y = np.random.rand(20)
    fig = figure(figsize=(6.5,12))
    subplots_adjust(wspace=0.2,hspace=0.2)
    iplot = 420
    for i in range(7):
       iplot += 1
       ax = fig.add_subplot(iplot)
       ax.plot(x,y,'ko')
       ax.set_xlabel("x")
       ax.set_ylabel("y")
    savefig("subplots_example.png",bbox_inches='tight')

然而,对于出版物来说,我认为这看起来有点丑 - 我想做的是将最后一个子图移动到两列之间的中心。那么,调整最后一个子图的位置以使其居中的最佳方法是什么?即在3X2网格中有前6个子图,最后一个子图在两列之间居中。如果可能的话,我想保留for循环,以便我可以简单地使用:

    if i == 6:
       # do something to reposition/centre this plot     

需要是一个3x2的网格吗? - Harpal
2个回答

15

使用 4x4 的网格规范 (文档),并使每个图都横跨 2 列,如下所示:

import matplotlib.gridspec as gridspec
gs = gridspec.GridSpec(4, 4)
ax1 = plt.subplot(gs[0, 0:2])
ax2 = plt.subplot(gs[0,2:])
ax3 = plt.subplot(gs[1,0:2])
ax4 = plt.subplot(gs[1,2:])
ax5 = plt.subplot(gs[2,0:2])
ax6 = plt.subplot(gs[2,2:])
ax7 = plt.subplot(gs[3,1:3])
fig = gcf()
gs.tight_layout(fig)
ax_lst = [ax1,ax2,ax3,ax4,ax5,ax6,ax7]

这个非常完美。您可以使用标准的matplotlib技术来控制网格之间的间距,从而允许带有标签的轴等 - 即fig = plt.figure(figsize=(10,15)) 然后在调用每个子图/网格之后 gs.tight_layout(fig) - AGS

9
如果你想保留for循环,你可以使用subplot2grid来安排你的图表,它允许使用colspan参数:
import numpy as np
import matplotlib.pyplot as plt

x = np.random.rand(20)
y = np.random.rand(20)
fig = plt.figure(figsize=(6.5,12))
plt.subplots_adjust(wspace=0.2,hspace=0.2)
iplot = 420
for i in range(7):
    iplot += 1
    if i == 6:
        ax = plt.subplot2grid((4,8), (i//2, 2), colspan=4)
    else:
        # You can be fancy and use subplot2grid for each plot, which doesn't
        # require keeping the iplot variable:
        # ax = plt.subplot2grid((4,2), (i//2,i%2))

        # Or you can keep using add_subplot, which may be simpler:
        ax = fig.add_subplot(iplot)
    ax.plot(x,y,'ko')
    ax.set_xlabel("x")
    ax.set_ylabel("y")
plt.savefig("subplots_example.png",bbox_inches='tight')

subplots in a grid with colspan


居中的子图比其他子图要大。在生成最后一个子图时,4列被挤压到与最初的2列相同的空间中,因此如果您仔细观察,居中子图的宽度等于其他子图的宽度加上两列之间间隙宽度的一半。可以使用GridSpec方法解决这个问题,如tacaswell所示的答案。 - Patrick FitzGerald

网页内容由stack overflow 提供, 点击上面的
可以查看英文原文,
原文链接