使用多个子图时改善子图大小/间距

547

我需要在matplotlib中生成一系列垂直堆叠的图表。结果将使用savefig保存并在网页上查看,因此我不关心最终图像有多高,只要子图间距足够以免重叠。

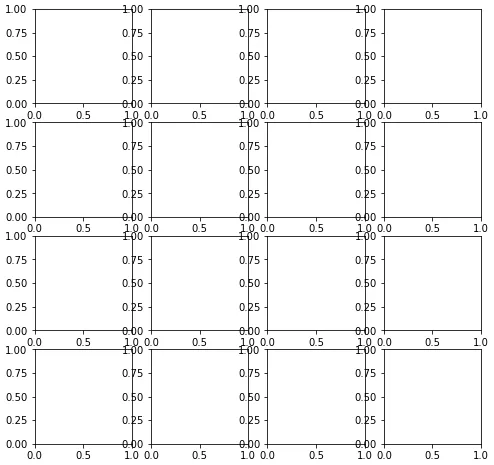
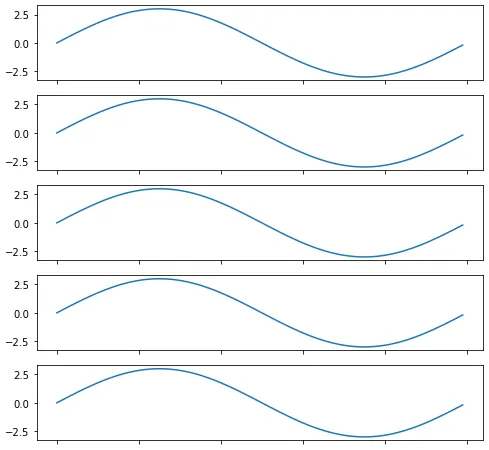
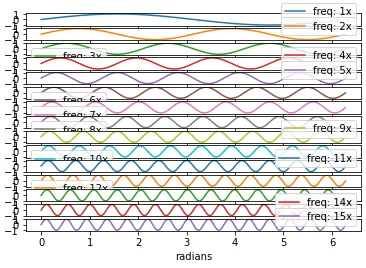
无论我允许图表变得多大,子图似乎总是重叠。

我的代码目前看起来像:

import matplotlib.pyplot as plt
import my_other_module

titles, x_lists, y_lists = my_other_module.get_data()

fig = plt.figure(figsize=(10,60))
for i, y_list in enumerate(y_lists):
    plt.subplot(len(titles), 1, i)
    plt.xlabel("Some X label")
    plt.ylabel("Some Y label")
    plt.title(titles[i])
    plt.plot(x_lists[i],y_list)
fig.savefig('out.png', dpi=100)

这个问题也适用于带有子图的pandas.DataFrame.plot,以及seaborn轴级别的绘图(那些带有ax参数的绘图):sns.lineplot(..., ax=ax) - Trenton McKinney
9个回答

726

1
所以 tight_layout() 使布局变得……_不那么_紧凑。有趣的名字。 - undefined

512
你可以使用plt.subplots_adjust函数来改变子图之间的间距。

调用示例:

subplots_adjust(left=None, bottom=None, right=None, top=None, wspace=None, hspace=None)

参数的含义(以及建议的默认值)是:

left  = 0.125  # the left side of the subplots of the figure
right = 0.9    # the right side of the subplots of the figure
bottom = 0.1   # the bottom of the subplots of the figure
top = 0.9      # the top of the subplots of the figure
wspace = 0.2   # the amount of width reserved for blank space between subplots
hspace = 0.2   # the amount of height reserved for white space between subplots

实际的默认设置由rc文件控制


1
不错!使用 plt.subplots_adjust(hspace = 0.3) 可以增加两个子图之间的垂直间距,这对我很管用。我在 plt.show() 之前调用它。注意:我相当确定数字 0.3 是以英寸为单位的。但我不确定他们如何处理不同屏幕大小的情况... - Gabriel Staples

97
tight_layout 类似,matplotlib 现在(自版本 2.2 起)提供了 constrained_layout。与 tight_layout 相反,后者可以在代码的任何时候调用以获得单个优化布局,constrained_layout 是一个属性,它可以在每个绘图步骤之前激活并优化布局。

因此,它需要在子图创建之前或期间激活,例如 figure(constrained_layout=True)subplots(constrained_layout=True)
示例:
import matplotlib.pyplot as plt

fig, axes = plt.subplots(4,4, constrained_layout=True)

plt.show()

enter image description here

可以通过rcParams设置constrained_layout

plt.rcParams['figure.constrained_layout.use'] = True

请查看新功能条目约束布局指南


使用constrained_layout = True会挤压文本吗?我知道使用tight_layout会改变所有尺寸,例如字体会变小。 - tetukowski

91

使用 subplots_adjust(hspace=0) 或者非常小的数值(hspace=0.001)将会完全移除子图之间的空白,而 hspace=None 则不会。

import numpy as np
import matplotlib.pyplot as plt
import matplotlib.ticker as tic

fig = plt.figure(figsize=(8, 8))

x = np.arange(100)
y = 3.*np.sin(x*2.*np.pi/100.)

for i in range(1, 6):
    temp = 510 + i
    ax = plt.subplot(temp)
    plt.plot(x, y)
    plt.subplots_adjust(hspace=0)
    temp = tic.MaxNLocator(3)
    ax.yaxis.set_major_locator(temp)
    ax.set_xticklabels(())
    ax.title.set_visible(False)

plt.show()

hspace=0hspace=0.001

这里输入图片描述

hspace=None

这里输入图片描述


我相信你可以将调用plt.subplots_adjust(hspace=0)的部分移到循环外面,从而达到相同的结果。 - undefined

37
import matplotlib.pyplot as plt

fig = plt.figure(figsize=(10,60))
plt.subplots_adjust( ... )

plt.subplots_adjust 方法:

def subplots_adjust(*args, **kwargs):
    """
    call signature::

      subplots_adjust(left=None, bottom=None, right=None, top=None,
                      wspace=None, hspace=None)

    Tune the subplot layout via the
    :class:`matplotlib.figure.SubplotParams` mechanism.  The parameter
    meanings (and suggested defaults) are::

      left  = 0.125  # the left side of the subplots of the figure
      right = 0.9    # the right side of the subplots of the figure
      bottom = 0.1   # the bottom of the subplots of the figure
      top = 0.9      # the top of the subplots of the figure
      wspace = 0.2   # the amount of width reserved for blank space between subplots
      hspace = 0.2   # the amount of height reserved for white space between subplots

    The actual defaults are controlled by the rc file
    """
    fig = gcf()
    fig.subplots_adjust(*args, **kwargs)
    draw_if_interactive()

或者

fig = plt.figure(figsize=(10,60))
fig.subplots_adjust( ... )

图片的大小很重要。

“我尝试过调整 hspace,但增加它似乎只会使所有图形变小而不能解决重叠问题。”

因此,为了获得更多的白色空间并保持子图的大小,总图像需要更大。


30

8
  • 当使用pandas.DataFrame.plot绘制数据框时,会出现问题,因为它默认使用matplotlib作为后端。
    • 无论指定了哪个kind=(例如'bar''scatter''hist'等),以下方法都适用。
  • python 3.8.12pandas 1.3.4matplotlib 3.4.3中测试通过

示例

import pandas as pd
import numpy as np
import matplotlib.pyplot as plt

# sinusoidal sample data
sample_length = range(1, 15+1)
rads = np.arange(0, 2*np.pi, 0.01)
data = np.array([np.sin(t*rads) for t in sample_length])
df = pd.DataFrame(data.T, index=pd.Series(rads.tolist(), name='radians'), columns=[f'freq: {i}x' for i in sample_length])

# default plot with subplots; each column is a subplot
axes = df.plot(subplots=True)

enter image description here

调整间距

  • pandas.DataFrame.plot 中调整默认参数
    1. 改变figsize: 对于每个子图,宽度为5,高度为4是一个不错的起点。
    2. 改变layout: (行, 列) 的子图布局。
    3. sharey=Truesharex=True 以便在每个子图上不会占用冗余标签的空间。
  • .plot 方法返回一个 numpy 数组 matplotlib.axes.Axes,应将其展平以便于处理。
  • 使用 .get_figure() 从一个 Axes 中提取 DataFrame.plot 图形对象。
  • 如果需要,可以使用 fig.tight_layout()
axes = df.plot(subplots=True, layout=(3, 5), figsize=(25, 16), sharex=True, sharey=True)

# flatten the axes array to easily access any subplot
axes = axes.flat

# extract the figure object
fig = axes[0].get_figure()

# use tight_layout
fig.tight_layout()

enter image description here

df

# display(df.head(3))
         freq: 1x  freq: 2x  freq: 3x  freq: 4x  freq: 5x  freq: 6x  freq: 7x  freq: 8x  freq: 9x  freq: 10x  freq: 11x  freq: 12x  freq: 13x  freq: 14x  freq: 15x
radians                                                                                                                                                            
0.00     0.000000  0.000000  0.000000  0.000000  0.000000  0.000000  0.000000  0.000000  0.000000   0.000000   0.000000   0.000000   0.000000   0.000000   0.000000
0.01     0.010000  0.019999  0.029996  0.039989  0.049979  0.059964  0.069943  0.079915  0.089879   0.099833   0.109778   0.119712   0.129634   0.139543   0.149438
0.02     0.019999  0.039989  0.059964  0.079915  0.099833  0.119712  0.139543  0.159318  0.179030   0.198669   0.218230   0.237703   0.257081   0.276356   0.295520

5
import matplotlib.pyplot as plt

# create the figure with tight_layout=True
fig, axes = plt.subplots(nrows=4, ncols=4, figsize=(8, 8), tight_layout=True)

enter image description here


2
如果使用 tight_layout=True 传递给 plt.subplots()fig.tight_layout(),仍无法在子图之间添加足够的间距,请考虑使用像 tight_layout(pad=2.0) 这样的 pad 进行调整,以获得所需的间距。

网页内容由stack overflow 提供, 点击上面的
可以查看英文原文,
原文链接