我正在尝试编写两个图表,使得一个图表在另一个下方。然而,我的代码一直将这两个图表排列在一起。
以下是我的代码:
import numpy as np
from scipy.integrate import odeint
from numpy import sin, cos, pi, array
import matplotlib
from matplotlib import rcParams
import matplotlib.pyplot as plt
from pylab import figure, axes, title, show
import xlsxwriter
plt.style.use('ggplot')
def deriv(z, t):
l = 0.25 #unextended length of the spring, in m
m = 0.25 #mass of the bob, in kg
k = 29.43 #spring constant, in Nm^-1
g = 9.81 #gravitational acceleration, in ms^-2
x, y, dxdt, dydt = z
dx2dt2 = (l+x)*(dydt)**2 - k/m*x + g*cos(y)
dy2dt2 = (-g*sin(y) - 2*(dxdt)*(dydt))/(l+x)
#equations of motion
return np.array([dxdt, dydt, dx2dt2, dy2dt2])
init = array([0, pi/2, 0, 0])
#initial conditions (x, y, xdot, ydot)
time = np.linspace(0, 10, 1000)
#time intervals (start, end, number of intervals)
sol = odeint(deriv, init, time)
#solving the equations of motion
x = sol[:,0]
y = sol[:,1]
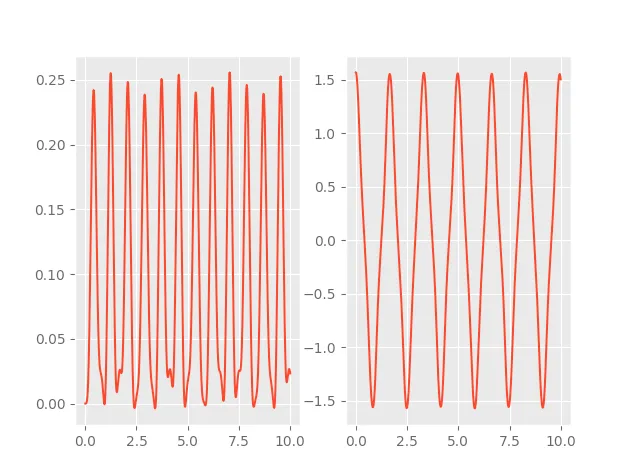
fig, (ax1, ax2) = plt.subplots(1, 2, sharex=True)
ax1.plot(time,x)
ax1.set_ylabel('hi')
ax2.plot(time,y)
ax2.set_ylabel('fds')
plt.plot()但我一直得到这个结果:
我已经尝试过:
plt.subplot(x)
plt.subplot(y)
plt.show()Traceback (most recent call last):
File "/Users/cnoxon/Desktop/Python/Final code 2 copy 2.py", line 39, in <module>
plt.subplot(x)
File "/Library/Frameworks/Python.framework/Versions/3.7/lib/python3.7/site-packages/matplotlib/pyplot.py", line 1084, in subplot
a = fig.add_subplot(*args, **kwargs)
File "/Library/Frameworks/Python.framework/Versions/3.7/lib/python3.7/site-packages/matplotlib/figure.py", line 1367, in add_subplot
a = subplot_class_factory(projection_class)(self, *args, **kwargs)
File "/Library/Frameworks/Python.framework/Versions/3.7/lib/python3.7/site-packages/matplotlib/axes/_subplots.py", line 39, in __init__
s = str(int(args[0]))
TypeError: only size-1 arrays can be converted to Python scalars
>>> 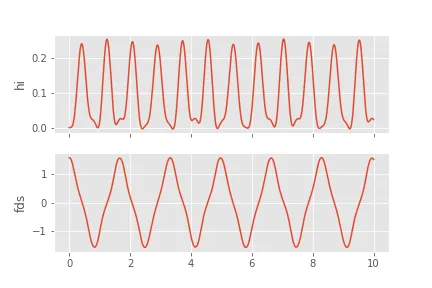
plt.subplots(1, 2, sharex=True)表示要并排绘制(1 行 2 列),只需将nrows和ncols参数翻转为plt.subplots(2, 1, sharex=True)(2 行 1 列)。 - AChampion