我正在尝试创建一个绘图函数,该函数以所需的图表数量作为输入,并使用
以下是示例代码。在此示例中,当
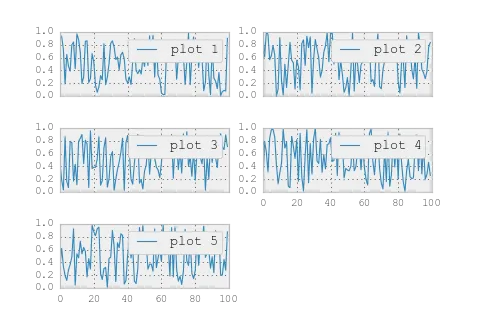
pylab.subplots和sharex=True选项进行绘制。如果所需的图表数量是奇数,则我想移除最后一个面板,并强制在其上方的面板上显示刻度标签。我找不到同时进行这两个操作并使用sharex=True选项的方法。子图的数量可能相当大(>20)。以下是示例代码。在此示例中,当
i=3时,我希望强制显示xtick标签。import numpy as np
import matplotlib.pylab as plt
def main():
n = 5
nx = 100
x = np.arange(nx)
if n % 2 == 0:
f, axs = plt.subplots(n/2, 2, sharex=True)
else:
f, axs = plt.subplots(n/2+1, 2, sharex=True)
for i in range(n):
y = np.random.rand(nx)
if i % 2 == 0:
axs[i/2, 0].plot(x, y, '-', label='plot '+str(i+1))
axs[i/2, 0].legend()
else:
axs[i/2, 1].plot(x, y, '-', label='plot '+str(i+1))
axs[i/2, 1].legend()
if n % 2 != 0:
f.delaxes(axs[i/2, 1])
f.show()
if __name__ == "__main__":
main()
delaxes似乎效率低下。我最终使用add_subplot来完成这个任务。但我不确定如何获取subplots中可用的sharex或sharey。 - CMCDragonkai