Python - blit在子图上只绘制最后一个子图

3

我正在尝试在我的Python应用程序中实时绘制多个子图。理想情况下,我还应该能够在每个子图中绘制多条线,但为了简单起见,我假设每个子图只有一条线。 为了高效地实现这一点(我正在寻找快速绘图),我正在尝试将我在网上找到的一个例子(https://taher-zadeh.com/speeding-matplotlib-plotting-times-real-time-monitoring-purposes/)扩展到我的情况。我的代码是:

import time    
# for Mac OSX
import matplotlib
matplotlib.use('TkAgg')   
import matplotlib.pylab as plt
import random

def test_fps(use_blit=True):

    ax1.cla()
    ax1.set_title('Sensor Input vs. Time -')
    ax1.set_xlabel('Time (s)')
    ax1.set_ylabel('Sensor Input (mV)')
    ax2.cla()
    ax2.set_title('Sensor Input vs. Time -' )
    ax2.set_xlabel('Time (s)')
    ax2.set_ylabel('Sensor Input (mV)')
    ax3.cla()
    ax3.set_title('Sensor Input vs. Time -')
    ax3.set_xlabel('Time (s)')
    ax3.set_ylabel('Sensor Input (mV)')
    ax4.cla()
    ax4.set_title('Sensor Input vs. Time -')
    ax4.set_xlabel('Time (s)')
    ax4.set_ylabel('Sensor Input (mV)')

    plt.ion()  # Set interactive mode ON, so matplotlib will not be blocking the window
    plt.show(False)  # Set to false so that the code doesn't stop here

    cur_time = time.time()
    ax1.hold(True)
    ax2.hold(True)
    ax3.hold(True)
    ax4.hold(True)

    x, y = [], []
    times = [time.time() - cur_time]  # Create blank array to hold time values
    y.append(0)

    line1, = ax1.plot(times, y, '.-', alpha=0.8, color="gray", markerfacecolor="red")
    line2, = ax2.plot(times, y, '.-', alpha=0.8, color="gray", markerfacecolor="red")
    line3, = ax3.plot(times, y, '.-', alpha=0.8, color="gray", markerfacecolor="red")
    line4, = ax4.plot(times, y, '.-', alpha=0.8, color="gray", markerfacecolor="red")


    fig.show()
    fig.canvas.draw()

    if use_blit:
        background1 = fig.canvas.copy_from_bbox(ax1.bbox) # cache the background
        background2 = fig.canvas.copy_from_bbox(ax2.bbox) # cache the background
        background3 = fig.canvas.copy_from_bbox(ax3.bbox) # cache the background
        background4 = fig.canvas.copy_from_bbox(ax4.bbox) # cache the background

    tic = time.time()

    niter = 200
    i = 0
    while i < niter:

        fields = random.random() * 100

        times.append(time.time() - cur_time)
        y.append(fields)

        # this removes the tail of the data so you can run for long hours. You can cache this
        # and store it in a pickle variable in parallel.

        if len(times) > 50:
           del y[0]
           del times[0]

        xmin, xmax, ymin, ymax = [min(times) / 1.05, max(times) * 1.1, -5,110]

        # feed the new data to the plot and set the axis limits again
        plt.axis([xmin, xmax, ymin, ymax])

        if use_blit:
            fig.canvas.restore_region(background1)    # restore background
            line1.set_xdata(times)
            line1.set_ydata(y)
            ax1.draw_artist(line1)                   # redraw just the points
            fig.canvas.blit(ax1.bbox)                # fill in the axes rectangle


            fig.canvas.restore_region(background2)    # restore background
            line2.set_xdata(times)
            line2.set_ydata(y)
            ax2.draw_artist(line2)                   # redraw just the points
            fig.canvas.blit(ax2.bbox)

            fig.canvas.restore_region(background3)    # restore background
            line3.set_xdata(times)
            line3.set_ydata(y)
            ax3.draw_artist(line3)                   # redraw just the points
            fig.canvas.blit(ax3.bbox)         

            fig.canvas.restore_region(background4)    # restore background
            line4.set_xdata(times)
            line4.set_ydata(y)
            ax4.draw_artist(line4)                   # redraw just the points
            fig.canvas.blit(ax4.bbox) 

        else:
            fig.canvas.draw()

        fig.canvas.flush_events()

        i += 1

    fps = niter / (time.time() - tic)
    return fps

并且

fig = plt.figure()
ax1 = fig.add_subplot(4, 1, 1)
ax2 = fig.add_subplot(4, 1, 2)
ax3 = fig.add_subplot(4, 1, 3)
ax4 = fig.add_subplot(4, 1, 4)
fps1 = test_fps(use_blit=True)

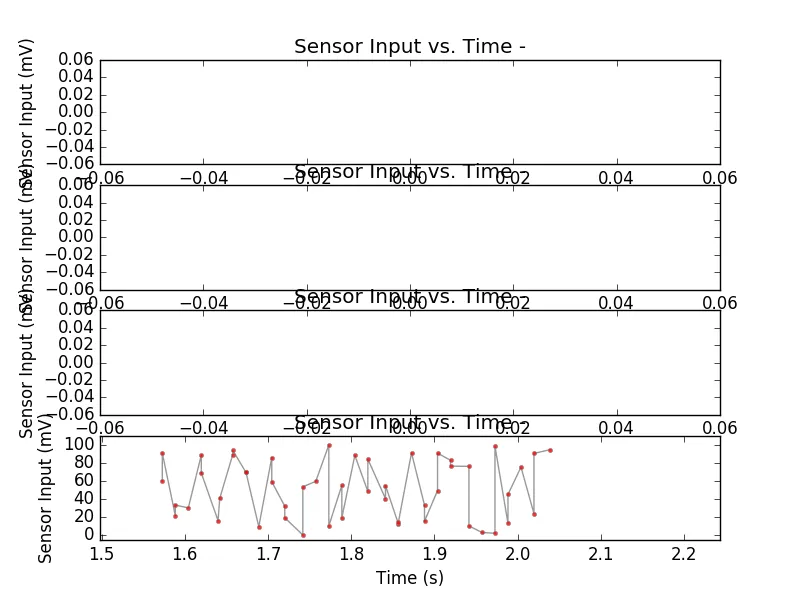
这段代码的问题在于它只在最后一个子图上绘制,其它子图则留空。

enter image description here

我刚接触Python,这可能是一个很愚蠢的问题,但我还没有搞清楚,所以任何提示对我都非常有帮助。谢谢

1个回答

4

在当前实现中,您仅为最后一个绘图设置轴限制,即plt.axis([xmin,xmax,ymin,ymax]) 适用于最后一个活动子图。

相反,您需要更新所有轴ax1ax4

ax1.axis([xmin, xmax, ymin, ymax])
ax2.axis([xmin, xmax, ymin, ymax])
ax3.axis([xmin, xmax, ymin, ymax])
ax4.axis([xmin, xmax, ymin, ymax])

让他们的极限跟随数据。

另外,更新数据似乎有利于在不进行 blitting 的情况下比较 blitting。

完整代码:

import time    
import matplotlib
matplotlib.use('TkAgg')   
import matplotlib.pylab as plt
import random

def test_fps(use_blit=True):

    ax1.cla()
    ax1.set_title('Sensor Input vs. Time -')
    ax1.set_xlabel('Time (s)')
    ax1.set_ylabel('Sensor Input (mV)')
    ax2.cla()
    ax2.set_title('Sensor Input vs. Time -' )
    ax2.set_xlabel('Time (s)')
    ax2.set_ylabel('Sensor Input (mV)')
    ax3.cla()
    ax3.set_title('Sensor Input vs. Time -')
    ax3.set_xlabel('Time (s)')
    ax3.set_ylabel('Sensor Input (mV)')
    ax4.cla()
    ax4.set_title('Sensor Input vs. Time -')
    ax4.set_xlabel('Time (s)')
    ax4.set_ylabel('Sensor Input (mV)')

    plt.ion()  # Set interactive mode ON, so matplotlib will not be blocking the window
    plt.show(False)  # Set to false so that the code doesn't stop here

    cur_time = time.time()
    #    ax1.hold(True)
    #    ax2.hold(True)
    #    ax3.hold(True)
    #    ax4.hold(True)

    x, y = [], []
    times = [time.time() - cur_time]  # Create blank array to hold time values
    y.append(0)

    line1, = ax1.plot(times, y, '.-', alpha=0.8, color="gray", markerfacecolor="red")
    line2, = ax2.plot(times, y, '.-', alpha=0.8, color="gray", markerfacecolor="red")
    line3, = ax3.plot(times, y, '.-', alpha=0.8, color="gray", markerfacecolor="red")
    line4, = ax4.plot(times, y, '.-', alpha=0.8, color="gray", markerfacecolor="red")


    fig.show()
    fig.canvas.draw()

    if use_blit:
        background1 = fig.canvas.copy_from_bbox(ax1.bbox) # cache the background
        background2 = fig.canvas.copy_from_bbox(ax2.bbox) # cache the background
        background3 = fig.canvas.copy_from_bbox(ax3.bbox) # cache the background
        background4 = fig.canvas.copy_from_bbox(ax4.bbox) # cache the background

    tic = time.time()

    niter = 200
    i = 0
    while i < niter:

        fields = random.random() * 100

        times.append(time.time() - cur_time)
        y.append(fields)

        # this removes the tail of the data so you can run for long hours. You can cache this
        # and store it in a pickle variable in parallel.

        if len(times) > 50:
           del y[0]
           del times[0]

        xmin, xmax, ymin, ymax = [min(times) / 1.05, max(times) * 1.1, -5,110]

        # feed the new data to the plot and set the axis limits again
        ax1.axis([xmin, xmax, ymin, ymax])
        ax2.axis([xmin, xmax, ymin, ymax])
        ax3.axis([xmin, xmax, ymin, ymax])
        ax4.axis([xmin, xmax, ymin, ymax])

        line1.set_data(times, y)
        line2.set_data(times, y)
        line3.set_data(times, y)
        line4.set_data(times, y)

        if use_blit:
            fig.canvas.restore_region(background1)    # restore background
            ax1.draw_artist(line1)                   # redraw just the points
            fig.canvas.blit(ax1.bbox)                # fill in the axes rectangle

            fig.canvas.restore_region(background2)    # restore background
            ax2.draw_artist(line2)                   # redraw just the points
            fig.canvas.blit(ax2.bbox)

            fig.canvas.restore_region(background3)    # restore background
            ax3.draw_artist(line3)                   # redraw just the points
            fig.canvas.blit(ax3.bbox)         

            fig.canvas.restore_region(background4)    # restore background
            ax4.draw_artist(line4)                   # redraw just the points
            fig.canvas.blit(ax4.bbox) 

        else:
            fig.canvas.draw()

        fig.canvas.flush_events()

        i += 1

    fps = niter / (time.time() - tic)
    return fps

fig = plt.figure()
ax1 = fig.add_subplot(4, 1, 1)
ax2 = fig.add_subplot(4, 1, 2)
ax3 = fig.add_subplot(4, 1, 3)
ax4 = fig.add_subplot(4, 1, 4)
fps1 = test_fps(use_blit=True)
print fps1

仅仅需要注意的是,在我的电脑上,不使用 blitting 时以10fps运行,在使用 blitting 时以16fps运行。


这个解决方案对我很有用,非常感谢。不过,在我的电脑上,没有blit时帧率为20 fps,使用blit后为96 fps,可以说是一个很好的改善。 - jappoz92
哦,那真是太好了。如果您有时间,我很想知道您在matplotlib部分的帧率,以便与我在那里得到的18和28 fps进行比较。这个答案 - ImportanceOfBeingErnest
我没有足够的声望在你的问题下添加评论。无论如何,通过运行复制粘贴的代码,使用matplotlib版本,我得到了大约13 fps(不使用blit)和16 fps(使用blit)。 - jappoz92
这看起来很合理,但问题是为什么在你的这个例子中帧速率会高得多。无论如何,感谢你分享这个。 - ImportanceOfBeingErnest

网页内容由stack overflow 提供, 点击上面的
可以查看英文原文,
原文链接