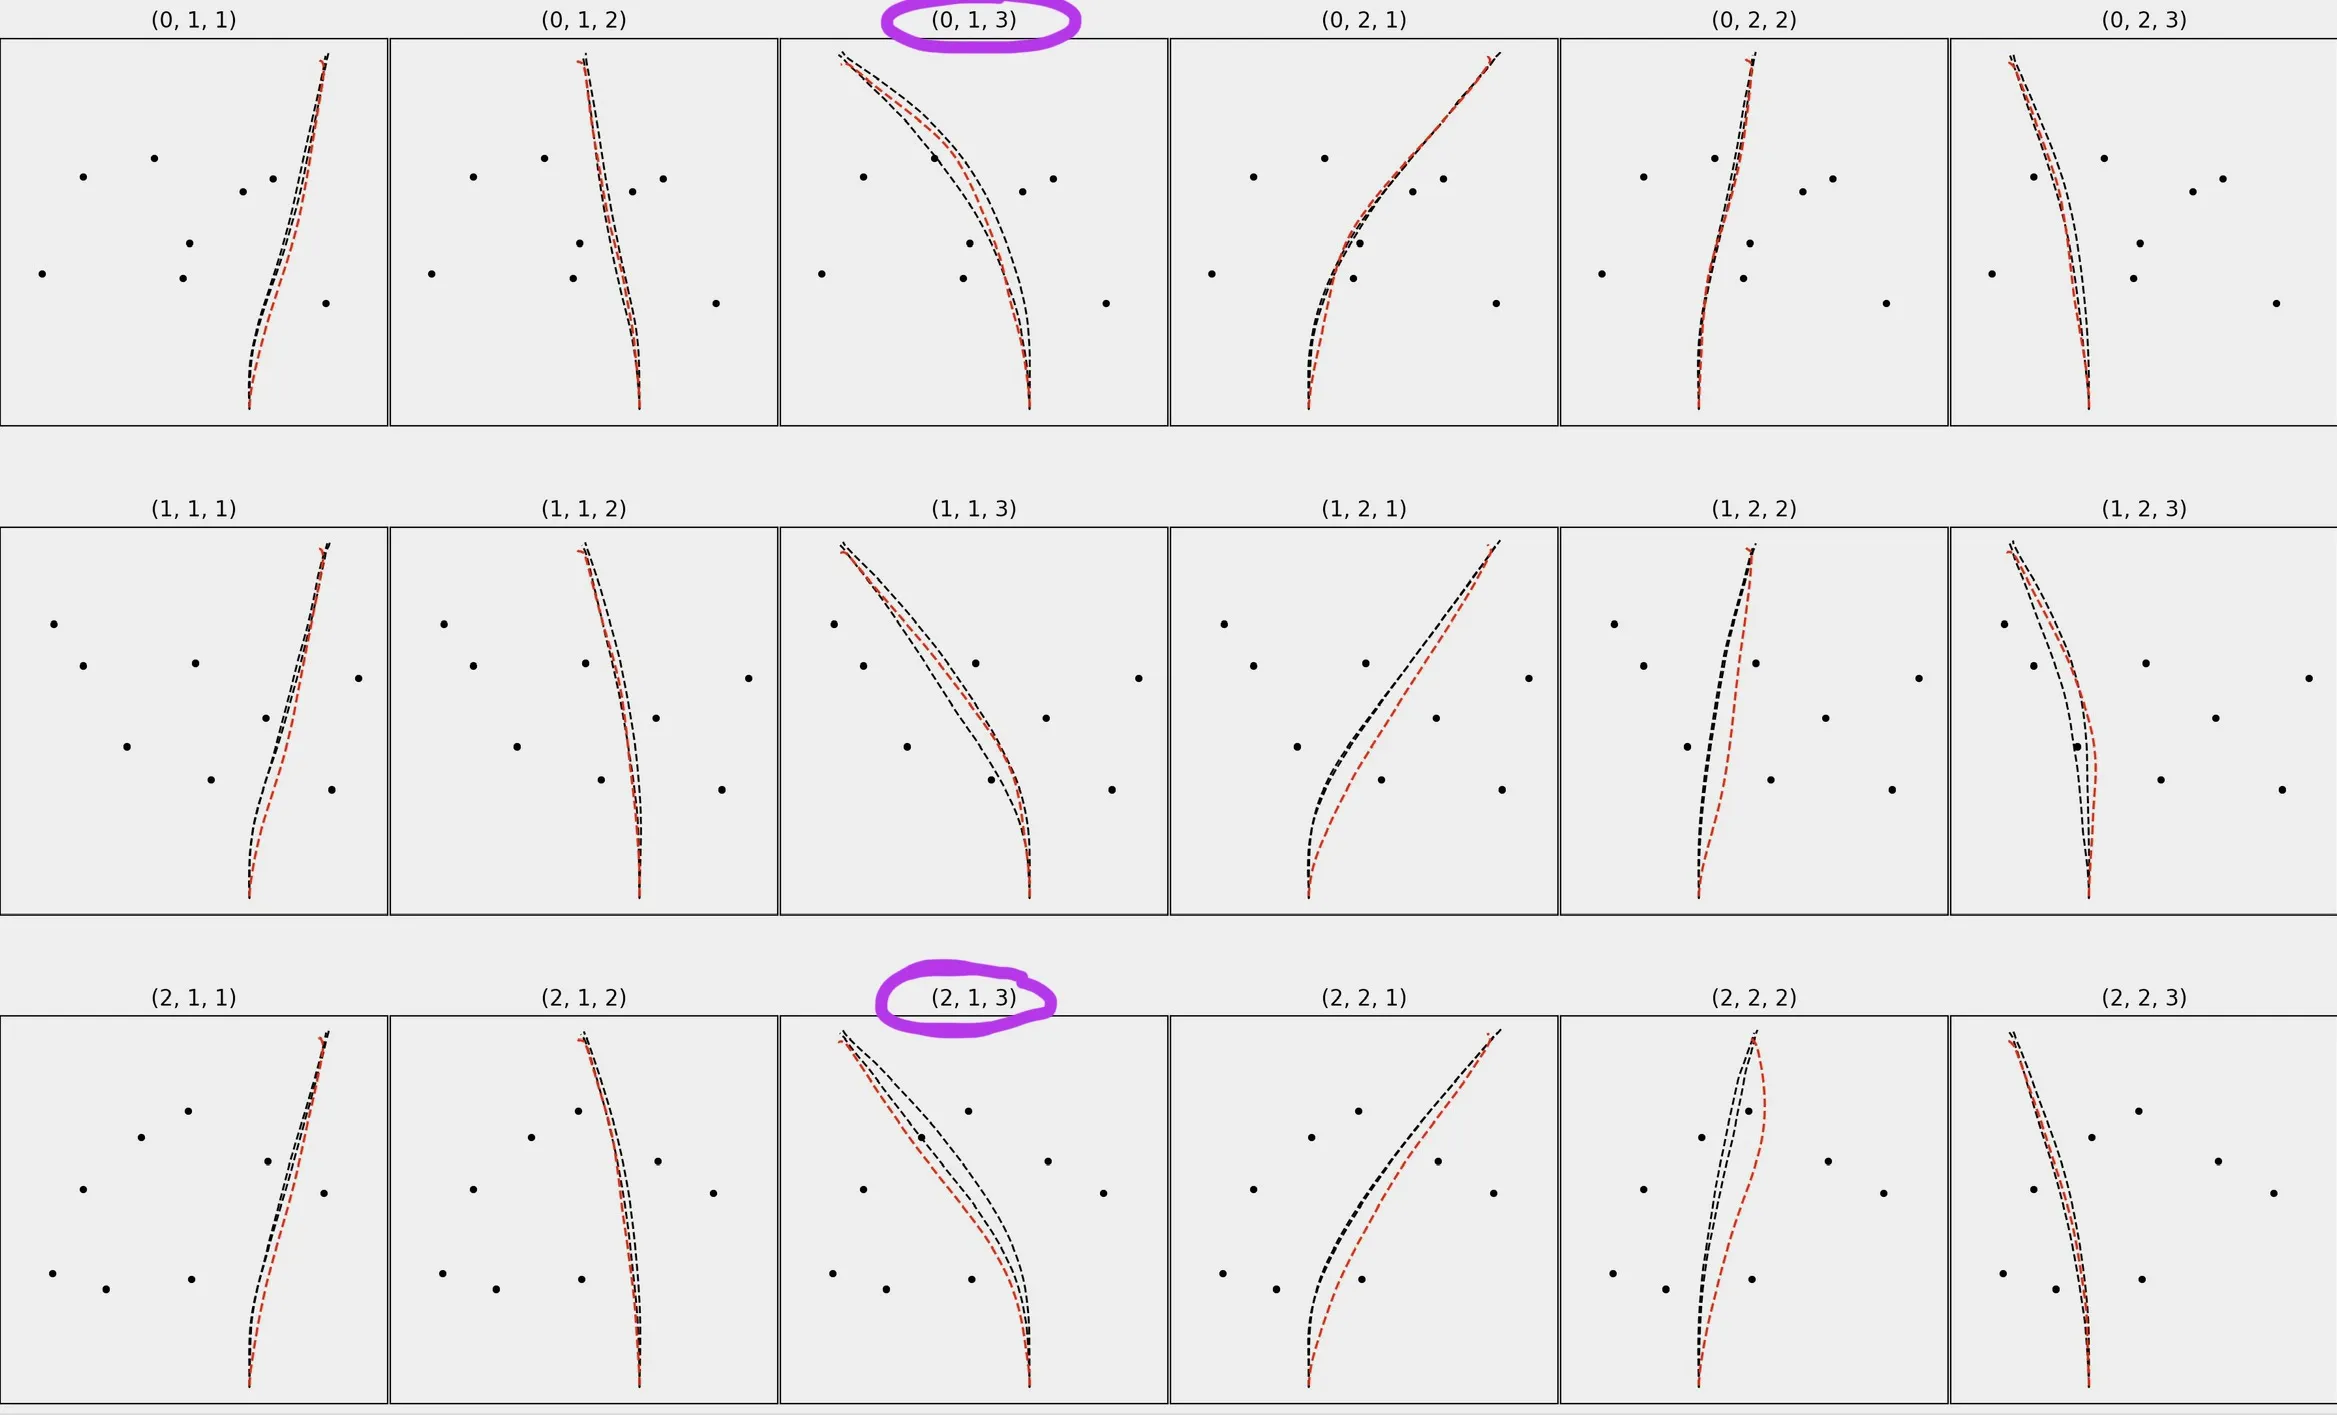
在广义上,我正在尝试计算红色路径/轨迹有多少落在许多不同试验的黑色路径之间(见下图)。 我圈出了一些示例,其中对于(0,1,3),大约30-40%的红色路径落在两个黑色路径之间,但对于(2,1,3),只有约1-2%的红色路径落在两个黑色路径之间。
df_R包含红色路径的位置数据(在X和Z中)。请注意,X和Z都是位置/空间数据。这些数据没有类似于日期/时间的索引。还要注意,这是来自Unity应用程序的2D数据(由于某种原因,X和Z等效于Y和X)。在两个数据框中,所有路径/轨迹长度均为1000个点。
df_R的预览:
我需要确认df_R中的X/Z值是否在df_H中的X/Z值范围内。然而,解决方案不能依赖于时间或索引(或逐行比较)。我一直试图实现这个功能,但卡住了。这是我一直在尝试的方法,但它不起作用,因为它依赖于时间。
最后,这里是用随机数复制df_R和df_H两个数据框的代码:
df_R包含红色路径的位置数据(在X和Z中)。请注意,X和Z都是位置/空间数据。这些数据没有类似于日期/时间的索引。还要注意,这是来自Unity应用程序的2D数据(由于某种原因,X和Z等效于Y和X)。在两个数据框中,所有路径/轨迹长度均为1000个点。
df_R的预览:
    (0, 1, 1)_mean_X  (0, 1, 1)_mean_Z  ...  (2, 2, 3)_mean_X  (2, 2, 3)_mean_Z
0         -15.856713          5.002617  ...        -15.600160         -5.010470
1         -15.831320          5.003529  ...        -15.566172         -5.012251
2         -15.805927          5.004441  ...        -15.532184         -5.014032
3         -15.780534          5.005353  ...        -15.498196         -5.015814
4         -15.755141          5.006265  ...        -15.464208         -5.017595
..               ...               ...  ...               ...               ...
95        -12.818362          5.429729  ...        -12.391177         -5.391595
96        -12.783905          5.437335  ...        -12.357563         -5.396919
97        -12.749456          5.444990  ...        -12.323950         -5.402243
98        -12.715017          5.452697  ...        -12.290336         -5.407567
99        -12.680594          5.460469  ...        -12.256722         -5.412891
df_H包含黑色路径的位置数据,其中包括X和Z的“顶部”和“底部”列,对应于每个图中的两条黑色路径。
df_H的预览:
    (0, 1, 1)_top_X  (0, 1, 1)_bottom_X  ...  (2, 2, 3)_top_Z  (2, 2, 3)_bottom_Z
0        -16.000000          -16.000000  ...        -5.000000           -5.000000
1        -16.000000          -16.000000  ...        -5.000000           -5.000000
2        -16.000000          -16.000000  ...        -5.000000           -5.000000
3        -16.000000          -16.000000  ...        -5.000000           -5.000000
4        -16.000000          -16.000000  ...        -5.000000           -5.000000
..              ...                 ...  ...              ...                 ...
95       -15.000971          -15.417215  ...        -4.993461           -5.011372
96       -14.979947          -15.402014  ...        -4.993399           -5.013007
97       -14.957949          -15.385840  ...        -4.993291           -5.014463
98       -14.934171          -15.368649  ...        -4.993186           -5.015692
99       -14.908484          -15.349371  ...        -4.993069           -5.016940
我需要确认df_R中的X/Z值是否在df_H中的X/Z值范围内。然而,解决方案不能依赖于时间或索引(或逐行比较)。我一直试图实现这个功能,但卡住了。这是我一直在尝试的方法,但它不起作用,因为它依赖于时间。
import pandas as pd
import numpy as np

def CI_analysis(df_H, df_R):

    # separate X & Z
    df_H_top_X = df_H.filter(regex='top_X')
    df_H_bottom_X = df_H.filter(regex='bottom_X')

    df_H_top_Z = df_H.filter(regex='top_Z')
    df_H_bottom_Z = df_H.filter(regex='bottom_Z')

    df_R_X = CI_raycast.filter(regex='mean_X')
    df_R_Z = CI_raycast.filter(regex='mean_Z')

    # check if X is within the range of top & bottom X
    CI_inside_X = pd.DataFrame()
    for col in df_R_X:
        temp = []
        c = 0
        for i, val in df_R_X[col].iteritems():
            if (val < df_H_top_X.iloc[i,c]) & (val > df_H_bottom_X.iloc[i,c]):
                temp.append(1)
            else:
                temp.append(0)
        CI_inside_X[col] = temp
        c = c+1

    # check if Z is within the range of top & bottom Z
    CI_inside_Z = pd.DataFrame()
    for col in df_R_Z:
        temp = []
        # print(col)
        c = 0
        for i, val in df_R_Z[col].iteritems():
            if (val < df_H_top_Z.iloc[i,c]) & (val > df_H_bottom_Z.iloc[i,c]):
                temp.append(1)
            else:
                temp.append(0)
        CI_inside_Z[col] = temp
        c = c+1

    # Check if X & Z were both in-between the top & bottom trajectories
    CI_inside = pd.DataFrame()
    for col in CI_inside_X:
        temp = []
        c = 0
        for i,row in CI_inside_X[col].iteritems():
            if (row == 1) & (CI_inside_Z.iloc[i,c] == 1):
                temp.append(1)
            else:
                temp.append(0)
        CI_inside[col] = temp
        c = c+1

    CI_inside_avg = pd.DataFrame(CI_inside.mean(axis=0)).transpose()

    return CI_inside_X, CI_inside_Z, CI_inside, CI_inside_avg
最后,这里是用随机数复制df_R和df_H两个数据框的代码:
df_R_cols = ['(0, 1, 1)_mean_X', '(0, 1, 1)_mean_Z', '(0, 1, 2)_mean_X',
       '(0, 1, 2)_mean_Z', '(0, 1, 3)_mean_X', '(0, 1, 3)_mean_Z',
       '(0, 2, 1)_mean_X', '(0, 2, 1)_mean_Z', '(0, 2, 2)_mean_X',
       '(0, 2, 2)_mean_Z', '(0, 2, 3)_mean_X', '(0, 2, 3)_mean_Z',
       '(1, 1, 1)_mean_X', '(1, 1, 1)_mean_Z', '(1, 1, 2)_mean_X',
       '(1, 1, 2)_mean_Z', '(1, 1, 3)_mean_X', '(1, 1, 3)_mean_Z',
       '(1, 2, 1)_mean_X', '(1, 2, 1)_mean_Z', '(1, 2, 2)_mean_X',
       '(1, 2, 2)_mean_Z', '(1, 2, 3)_mean_X', '(1, 2, 3)_mean_Z',
       '(2, 1, 1)_mean_X', '(2, 1, 1)_mean_Z', '(2, 1, 2)_mean_X',
       '(2, 1, 2)_mean_Z', '(2, 1, 3)_mean_X', '(2, 1, 3)_mean_Z',
       '(2, 2, 1)_mean_X', '(2, 2, 1)_mean_Z', '(2, 2, 2)_mean_X',
       '(2, 2, 2)_mean_Z', '(2, 2, 3)_mean_X', '(2, 2, 3)_mean_Z']

df_H_cols = ['(0, 1, 1)_top_X', '(0, 1, 1)_bottom_X', '(0, 1, 1)_top_Z',
       '(0, 1, 1)_bottom_Z', '(0, 1, 2)_top_X', '(0, 1, 2)_bottom_X',
       '(0, 1, 2)_top_Z', '(0, 1, 2)_bottom_Z', '(0, 1, 3)_top_X',
       '(0, 1, 3)_bottom_X', '(0, 1, 3)_top_Z', '(0, 1, 3)_bottom_Z',
       '(0, 2, 1)_top_X', '(0, 2, 1)_bottom_X', '(0, 2, 1)_top_Z',
       '(0, 2, 1)_bottom_Z', '(0, 2, 2)_top_X', '(0, 2, 2)_bottom_X',
       '(0, 2, 2)_top_Z', '(0, 2, 2)_bottom_Z', '(0, 2, 3)_top_X',
       '(0, 2, 3)_bottom_X', '(0, 2, 3)_top_Z', '(0, 2, 3)_bottom_Z',
       '(1, 1, 1)_top_X', '(1, 1, 1)_bottom_X', '(1, 1, 1)_top_Z',
       '(1, 1, 1)_bottom_Z', '(1, 1, 2)_top_X', '(1, 1, 2)_bottom_X',
       '(1, 1, 2)_top_Z', '(1, 1, 2)_bottom_Z', '(1, 1, 3)_top_X',
       '(1, 1, 3)_bottom_X', '(1, 1, 3)_top_Z', '(1, 1, 3)_bottom_Z',
       '(1, 2, 1)_top_X', '(1, 2, 1)_bottom_X', '(1, 2, 1)_top_Z',
       '(1, 2, 1)_bottom_Z', '(1, 2, 2)_top_X', '(1, 2, 2)_bottom_X',
       '(1, 2, 2)_top_Z', '(1, 2, 2)_bottom_Z', '(1, 2, 3)_top_X',
       '(1, 2, 3)_bottom_X', '(1, 2, 3)_top_Z', '(1, 2, 3)_bottom_Z',
       '(2, 1, 1)_top_X', '(2, 1, 1)_bottom_X', '(2, 1, 1)_top_Z',
       '(2, 1, 1)_bottom_Z', '(2, 1, 2)_top_X', '(2, 1, 2)_bottom_X',
       '(2, 1, 2)_top_Z', '(2, 1, 2)_bottom_Z', '(2, 1, 3)_top_X',
       '(2, 1, 3)_bottom_X', '(2, 1, 3)_top_Z', '(2, 1, 3)_bottom_Z',
       '(2, 2, 1)_top_X', '(2, 2, 1)_bottom_X', '(2, 2, 1)_top_Z',
       '(2, 2, 1)_bottom_Z', '(2, 2, 2)_top_X', '(2, 2, 2)_bottom_X',
       '(2, 2, 2)_top_Z', '(2, 2, 2)_bottom_Z', '(2, 2, 3)_top_X',
       '(2, 2, 3)_bottom_X', '(2, 2, 3)_top_Z', '(2, 2, 3)_bottom_Z']

df_R = pd.DataFrame(np.random.randint(0,100,size=(1000, 36)), columns=df_R_cols)
df_H = pd.DataFrame(np.random.randint(0,100,size=(1000, 72)), columns=df_H_cols)
x_black1 <= x_Red <= x_black2的行数/总桶数。如果您的所有Y值已对齐,则应该不难做到这一点?最好在pandas datatrames之外完成此操作。 - Tommy[(x_b1, x_r, x_b2),....],其中每个3元组都是为相同的Y值而设计的;然后计算比率。例如:读取您的数据帧并将它们转储到这个桶结构中。 - Tommyfloor(Yval / bucket_size)或类似的内容。 - Tommy