在轨迹(路径)中计算转折点/支撑位点

32
我正在尝试设计一个算法来确定x/y坐标轨迹中的转折点。下图说明了我的意思:绿色表示轨迹的起始点,红色表示终点(整个轨迹由约1500个点组成): trajectory 在下图中,我手动添加了算法可能返回的可能(全局)转折点:

trajectory with possible turning points

显然,真正的转折点总是有争议的,并且取决于一个人指定的角度,该角度必须位于点之间。此外,转折点可以在全局尺度上定义(我试图用黑色圆圈来做到这一点),但也可以在高分辨率的局部尺度上定义。我对全局(整体)方向变化很感兴趣,但我希望看到关于如何区分全局与局部解决方案的不同方法的讨论。
我已经尝试过的内容:
- 计算相邻点之间的距离 - 计算相邻点之间的角度 - 查看相邻点之间的距离/角度变化
不幸的是,这并没有给我任何可靠的结果。我可能需要计算多个点的曲率,但那只是一个想法。我真的很感激任何可能帮助我的算法/想法。代码可以使用任何编程语言,但Matlab或Python更受欢迎。
编辑:以下是原始数据(以防有人想玩):

非常有趣的问题,但我不确定这个论坛是否是提问的正确场所。我看到许多主观的方法来定义轨迹上的转折点,例如你在什么尺度上看它。当你仔细观察时,我可以看到许多不同的转折点。处理的方法可能是对每个点两侧的点进行某种平滑处理(或者只是使用n个点画一条直线),并根据这两条直线之间的角度做出决策。然后,您将只有“两个”参数(n和最小角度),尽管有直线化算法。也许这会有所帮助? - Alex
@Alex 我知道这个问题存在主观性。但我仍然认为这可能是一个普遍感兴趣的问题,我很想看到人们讨论不同的方法来区分局部转折点和全局转折点。 - memyself
5个回答

31
你可以使用Ramer-Douglas-Peucker (RDP)算法来简化路径。然后,您可以计算沿简化路径的每个段落中方向的变化。对应于方向变化最大的点可以称为转折点: 在github上可以找到RDP算法的Python实现。
import matplotlib.pyplot as plt
import numpy as np
import os
import rdp

def angle(dir):
    """
    Returns the angles between vectors.

    Parameters:
    dir is a 2D-array of shape (N,M) representing N vectors in M-dimensional space.

    The return value is a 1D-array of values of shape (N-1,), with each value
    between 0 and pi.

    0 implies the vectors point in the same direction
    pi/2 implies the vectors are orthogonal
    pi implies the vectors point in opposite directions
    """
    dir2 = dir[1:]
    dir1 = dir[:-1]
    return np.arccos((dir1*dir2).sum(axis=1)/(
        np.sqrt((dir1**2).sum(axis=1)*(dir2**2).sum(axis=1))))

tolerance = 70
min_angle = np.pi*0.22
filename = os.path.expanduser('~/tmp/bla.data')
points = np.genfromtxt(filename).T
print(len(points))
x, y = points.T

# Use the Ramer-Douglas-Peucker algorithm to simplify the path
# http://en.wikipedia.org/wiki/Ramer-Douglas-Peucker_algorithm
# Python implementation: https://github.com/sebleier/RDP/
simplified = np.array(rdp.rdp(points.tolist(), tolerance))

print(len(simplified))
sx, sy = simplified.T

# compute the direction vectors on the simplified curve
directions = np.diff(simplified, axis=0)
theta = angle(directions)
# Select the index of the points with the greatest theta
# Large theta is associated with greatest change in direction.
idx = np.where(theta>min_angle)[0]+1

fig = plt.figure()
ax =fig.add_subplot(111)

ax.plot(x, y, 'b-', label='original path')
ax.plot(sx, sy, 'g--', label='simplified path')
ax.plot(sx[idx], sy[idx], 'ro', markersize = 10, label='turning points')
ax.invert_yaxis()
plt.legend(loc='best')
plt.show()

enter image description here

上面使用了两个参数:

  1. RDP算法只需要一个参数,即tolerance,表示简化路径与原始路径可以偏差的最大距离。 tolerance越大,简化后的路径越粗糙。
  2. 另一个参数是min_angle,定义了什么是转折点。(我将转折点定义为原始路径上的任何一点,在简化路径上进入和退出向量之间的角度大于min_angle)。

这似乎是我尝试使用凸包方法实现的内容,因为我有快速凸壳在脑海中。点赞并且需要记住这个方法。我的唯一问题是它应该基于最小角度来考虑转弯而不是点数。 - Nuclearman
@MC:好主意。谢谢。(更改已经完成。) - unutbu

11
我将在下面提供numpy/scipy的代码,因为我几乎没有Matlab经验。
如果你的曲线足够平滑,你可以将转折点识别为最高曲率点。以点索引号作为曲线参数,使用中心差分方案,你可以使用以下代码计算曲率。
import numpy as np
import matplotlib.pyplot as plt
import scipy.ndimage

def first_derivative(x) :
    return x[2:] - x[0:-2]

def second_derivative(x) :
    return x[2:] - 2 * x[1:-1] + x[:-2]

def curvature(x, y) :
    x_1 = first_derivative(x)
    x_2 = second_derivative(x)
    y_1 = first_derivative(y)
    y_2 = second_derivative(y)
    return np.abs(x_1 * y_2 - y_1 * x_2) / np.sqrt((x_1**2 + y_1**2)**3)

你可能需要先平滑曲线,然后计算曲率,接着找出最高曲率点。以下函数正是实现这一目的:
def plot_turning_points(x, y, turning_points=10, smoothing_radius=3,
                        cluster_radius=10) :
    if smoothing_radius :
        weights = np.ones(2 * smoothing_radius + 1)
        new_x = scipy.ndimage.convolve1d(x, weights, mode='constant', cval=0.0)
        new_x = new_x[smoothing_radius:-smoothing_radius] / np.sum(weights)
        new_y = scipy.ndimage.convolve1d(y, weights, mode='constant', cval=0.0)
        new_y = new_y[smoothing_radius:-smoothing_radius] / np.sum(weights)
    else :
        new_x, new_y = x, y
    k = curvature(new_x, new_y)
    turn_point_idx = np.argsort(k)[::-1]
    t_points = []
    while len(t_points) < turning_points and len(turn_point_idx) > 0:
        t_points += [turn_point_idx[0]]
        idx = np.abs(turn_point_idx - turn_point_idx[0]) > cluster_radius
        turn_point_idx = turn_point_idx[idx]
    t_points = np.array(t_points)
    t_points += smoothing_radius + 1
    plt.plot(x,y, 'k-')
    plt.plot(new_x, new_y, 'r-')
    plt.plot(x[t_points], y[t_points], 'o')
    plt.show()

需要进行一些解释:

  • turning_points 是你想要识别的点数。
  • smoothing_radius 是在计算曲率之前应用于数据的平滑卷积半径。
  • cluster_radius 是从选择为拐点的高曲率点到不考虑其他点的距离。

您可能需要稍微调整一下参数,但我得到了类似这样的结果:

>>> x, y = np.genfromtxt('bla.data')
>>> plot_turning_points(x, y, turning_points=20, smoothing_radius=15,
...                     cluster_radius=75)

enter image description here

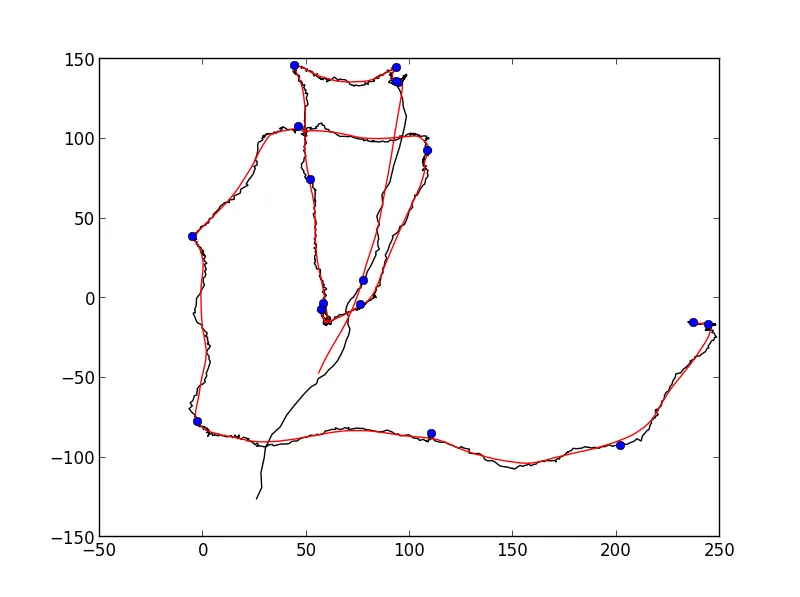
可能不够完全自动化的检测,但它非常接近你想要的。
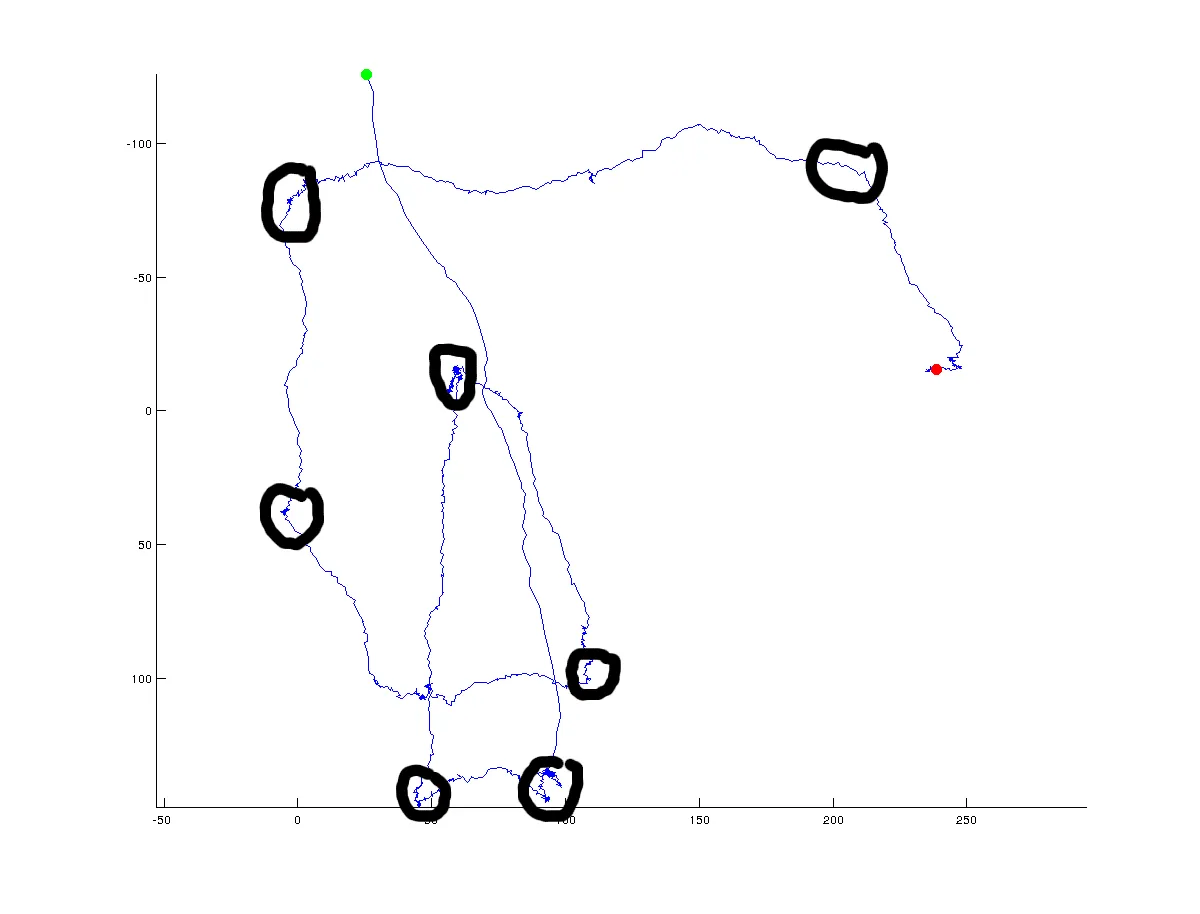
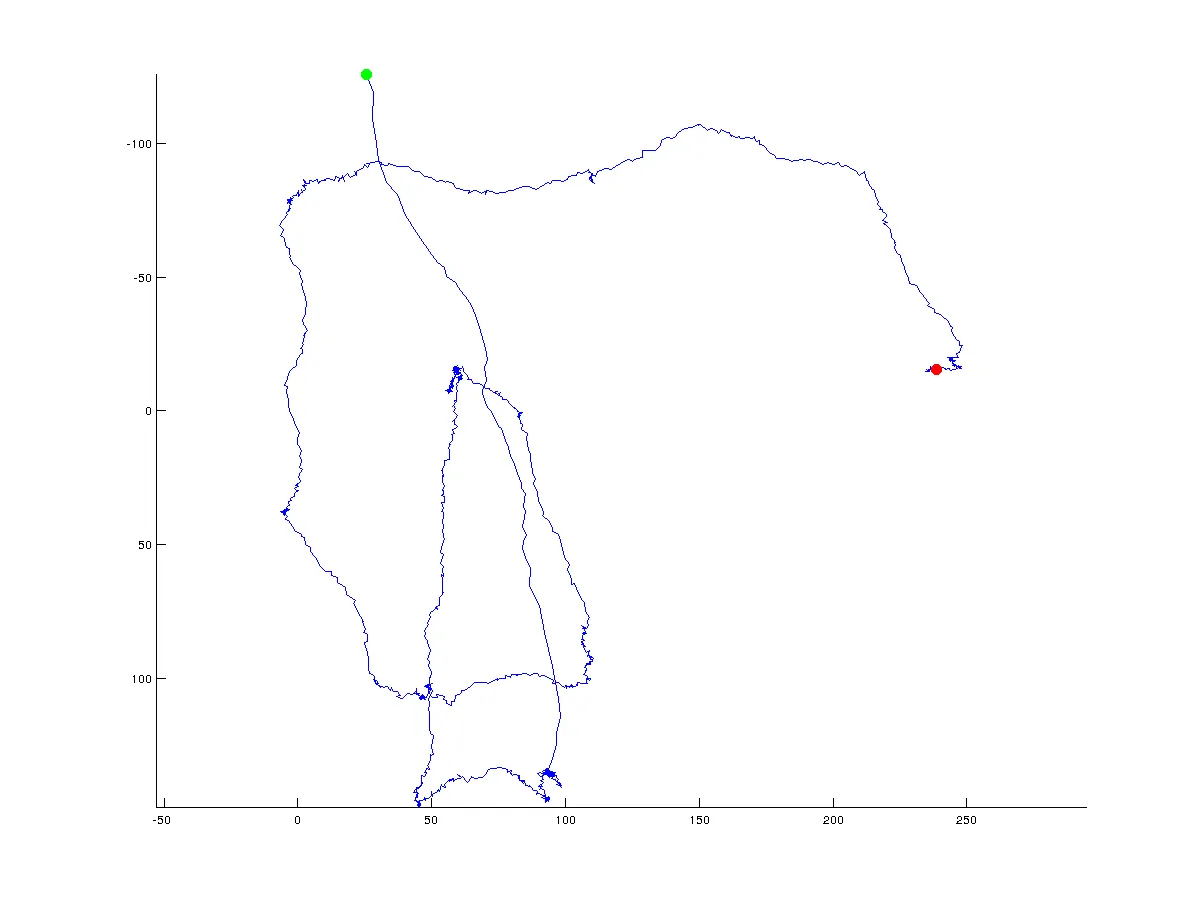

4
一个非常有趣的问题。这里是我的解决方案,可以允许可变分辨率。虽然微调可能不简单,因为它主要旨在缩小范围。
每k个点,计算凸包并将其存储为一个集合。遍历最多k个点,并删除任何不在凸包中的点,使得点不会失去其原始顺序。
这里的目的是凸包将作为过滤器,删除所有“不重要的点”,只留下极端点。当然,如果k值太高,你将得到一个距离实际凸包太接近的东西,而不是你实际想要的东西。
应该从一个小的k开始,至少为4,然后增加它,直到你得到你想要的结果。你也应该只包括每3个点的中间点,其中角度低于某个数量d。这将确保所有的旋转至少为d度(未在下面的代码中实现)。但是,这应该逐步进行,以避免信息的丢失,就像增加k值一样。另一个可能的改进是实际上重新运行被移除的点,并仅删除没有出现在两个凸包中的点,尽管这需要一个至少为8的更高的最小k值。
以下代码似乎工作得相当好,但仍然可以进一步改进以提高效率和去噪。在确定何时停止时,它也相当不优雅,因此代码实际上只能从k=4到k=14左右运行。
def convex_filter(points,k):
    new_points = []
    for pts in (points[i:i + k] for i in xrange(0, len(points), k)):
        hull = set(convex_hull(pts))
        for point in pts:
            if point in hull:
                new_points.append(point)
    return new_points

# How the points are obtained is a minor point, but they need to be in the right order.
x_coords = [float(x) for x in x.split()]
y_coords = [float(y) for y in y.split()]
points = zip(x_coords,y_coords)

k = 10

prev_length = 0
new_points = points

# Filter using the convex hull until no more points are removed
while len(new_points) != prev_length:
    prev_length = len(new_points)
    new_points = convex_filter(new_points,k)

下面是k = 14时代码的屏幕截图。在过滤器后,仅剩下61个红色点。 Convex Filter Example

1
您采取的方法听起来很有前途,但是您的数据过度采样。例如,您可以先使用宽高斯滤波器过滤x和y坐标,然后进行下采样。
在MATLAB中,您可以使用 x = conv(x, normpdf(-10 : 10, 0, 5)) 然后使用 x = x(1 : 5 : end)。您需要根据跟踪对象的固有持久性和点之间的平均距离来调整这些数字。
然后,您将能够非常可靠地检测方向变化,使用您之前尝试过的相同方法,基于标量积,我想象。

0
另一个想法是在每个点处检查左右环境。可以通过在每个点之前和之后创建N个点的线性回归来完成此操作。如果点之间的交角低于某个阈值,则存在一个拐角。
通过保持当前在线性回归中的点的队列并用新点替换旧点,类似于运行平均值,可以有效地完成此操作。
最后,您必须将相邻的角落合并为一个角落。例如选择具有最强角属性的点。

网页内容由stack overflow 提供, 点击上面的
可以查看英文原文,
原文链接