from mpl_toolkits.mplot3d import Axes3D

ax.scatter(X_lda[:,0], X_lda[:,1], X_lda[:,2], alpha=0.4, c=y_train, cmap='rainbow', s=20)

plt.legend()
plt.show()
- 基本上,我想在散点图中添加一个说明,显示y_train中的唯一值以及对应于绘图的点的颜色。
- 输出图:
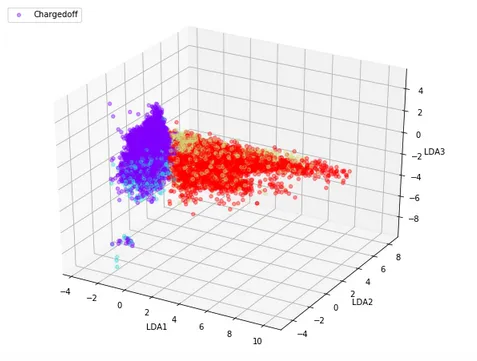
from mpl_toolkits.mplot3d import Axes3D
ax.scatter(X_lda[:,0], X_lda[:,1], X_lda[:,2], alpha=0.4, c=y_train, cmap='rainbow', s=20)
plt.legend()
plt.show()
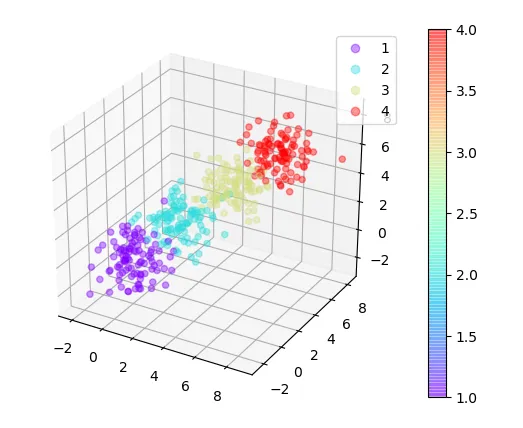
为散点图生成图例或色条通常非常简单:
import numpy as np
import matplotlib.pyplot as plt
from mpl_toolkits.mplot3d import Axes3D

x,y,z = (np.random.normal(size=(300,4))+np.array([0,2,4,6])).reshape(3,400)
c = np.tile([1,2,3,4], 100)

fig, ax = plt.subplots(subplot_kw=dict(projection="3d"))
sc = ax.scatter(x,y,z, alpha=0.4, c=c, cmap='rainbow', s=20)

plt.legend(*sc.legend_elements())
plt.colorbar(sc)
plt.show()