我想创建一个带有尺寸和颜色图例的三维散点图。然而,仅显示列表中第一种颜色的颜色图例。
import matplotlib.pyplot as plt
import matplotlib.colors
# Visualizing 5-D mix data using bubble charts
# leveraging the concepts of hue, size and depth
fig = plt.figure(figsize=(8, 6))
ax = fig.add_subplot(111, projection='3d')
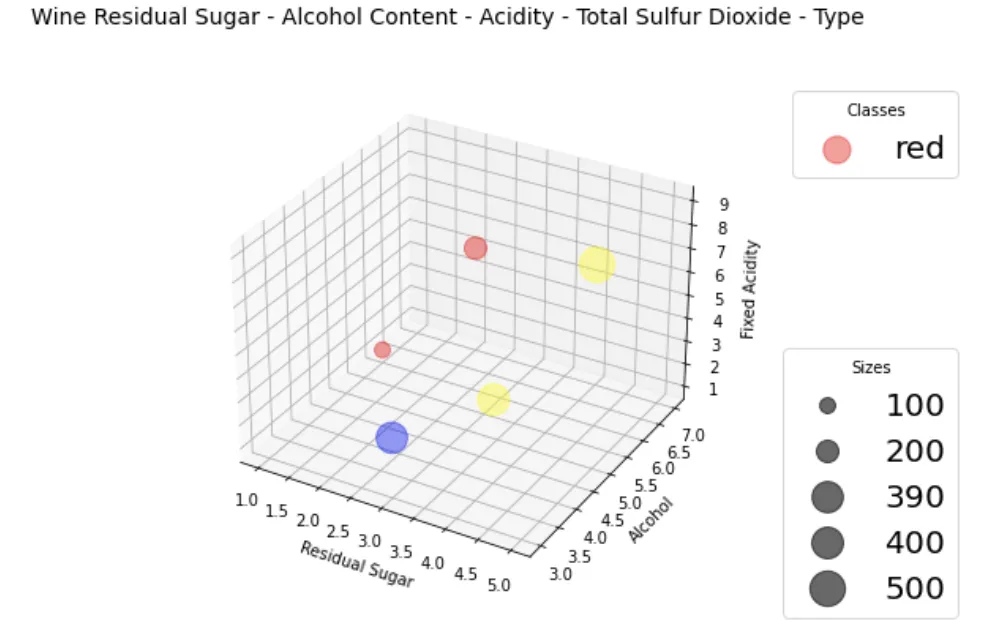
t = fig.suptitle('Wine Residual Sugar - Alcohol Content - Acidity - Total Sulfur Dioxide - Type', fontsize=14)
xs = [1,2,3,5,4]
ys = [6,7,3,5,4]
zs = [1,5,3,9,4]
data_points = [(x, y, z) for x, y, z in zip(xs, ys, zs)]
ss = [100,200,390,500,400]
colors = ['red','red','blue','yellow','yellow']
scatter = ax.scatter(xs, ys, zs, alpha=0.4, c=colors, s=ss)
ax.set_xlabel('Residual Sugar')
ax.set_ylabel('Alcohol')
ax.set_zlabel('Fixed Acidity')
legend1 = ax.legend(*scatter.legend_elements()[0],
loc="upper right", title="Classes", labels=colors, bbox_to_anchor=(1.5, 1),prop={'size': 20})
ax.add_artist(legend1)
# produce a legend with a cross section of sizes from the scatter
handles, labels = scatter.legend_elements(prop="sizes", alpha=0.6)
legend2 = ax.legend(handles, labels, loc="upper right", title="Sizes", bbox_to_anchor=(1.5, 0.5), prop={'size': 20})